During 2018, the Small Business Administration (SBA) funded more than 66,000 loans through the 7(a) and 504 programs. These loans provided over $30 billion to small businesses throughout the United States, supporting nearly 600,000 jobs. Interestingly, SBA lending in 2018 primarily supported fast food and fitness franchises.
Note: The following SBA statistics are based on our analysis of the most recent SBA loan data available, which is from 2018.
What SBA Statistics are Included in Our Evaluation
The SBA loan statistics include the number of loans made, the total dollar amount of those loans, and the top SBA lender for each state. Additionally, we evaluated loans by industry, including the number of jobs supported in the corresponding sector. Further statistics include the number of SBA franchise loans, as well as the top franchise in the state.
The primary SBA loan statistic data and small business industry data that we have collected and reported is broken down into 12 primary key data points. Each data point, definition, calculation method, and source are provided below.
The SBA loan statistics and small business industry statistics for each state and territory are:
SBA Loan Statistics on Loan Originations & Defaults
For each state and territory, we evaluated key SBA loan statistics. This included such factors as the total number and dollar amount of loans originated in 2018, along with the average interest rate and loan term. We also evaluated the average default rate in each state and territory for loans originated from 2010 to 2018.
- Top lender for SBA loans approved in 2018: With thousands of SBA lenders nationwide, we identified the top lender in each state for 2018. If you are looking for an SBA loan, this lender will be well-versed in the processes involved with getting an SBA loan approved. The best SBA lender for the state was determined by the number of SBA loans originated by that lender in 2018.
- Number of SBA loans approved in 2018: This represents the number of SBA loans made in the state in 2018, using data provided by the Small Business Administration. The value includes all SBA 7a loans and SBA Express loans that were approved during the fiscal year.
- Dollar amount of SBA loans approved in 2018: The total dollar amount of SBA loans made in 2018 is based on data directly from the Small Business Administration. The value represents the total dollar amount of loans approved in fiscal year 2018. Because this value is based on approval date, rather than funding date, it is possible that some loan funds were not actually expended until fiscal year 2019.
- Average interest rate of SBA loans approved in 2018: The average interest rate for all SBA loans made within the state in 2018. This value is based on data directly from the Small Business Administration.
- Average loan term of SBA loans originated in 2018: The average loan term (in years) for all SBA loans made within the state in 2018. This value is based on data directly from the Small Business Administration.
- Average default rate of SBA loans originated from 2010 to 2018: The percentage of SBA loans made within the state between 2010 and 2018 that have resulted in default. This figure is based on the number of loans that the SBA has coded as canceled or charged off divided by the total number of loans made in the state.
SBA Statistics on Top Industries and Jobs Supported
In our analysis of SBA statistics, we included an evaluation of the top industries supported by SBA loans, as well as the number of jobs created by these loans. This included comparing how many loans were originated for the top NAICS codes, and comparing this data to how many businesses within those industries exist in the state or territory. It also included evaluating how many jobs SBA loans supported compared to how many people are employed by small businesses in the state or territory.
The SBA statistics on industries and jobs we evaluated include:
- Top NAICS code for SBA loans originated from 2010 to 2018: The North American Industry Classification System (NAICS) is used to classify businesses for the purpose of collecting statistical data. Based on data provided from the SBA, the top NAICS code and industry is representative of the most frequently loaned to industry between 2010 and 2018.
- Number of jobs supported by SBA loans in 2018: This value represents the cumulative sum of the number of jobs that the SBA borrowers reported would be benefited, or created, by the SBA loan that they received. This data was taken directly from reporting by the Small Business Administration.
- Number of jobs supported by SBA loans from 2010 to 2018: This value represents the cumulative sum, from 2010 through 2018, of the number of jobs that SBA borrowers reported would be benefited, or created, by the SBA loan that they received. This data determined based on reports directly from the Small Business Administration.
- Number of people employed by small businesses in the state: This value represents the number of people in the state that are employed by small businesses. Small businesses are defined as individual businesses employing less than 500 people. The data is based on 2016 U.S. Census reporting.
NAICS Industry and Sector Codes
SBA Statistics on Franchises
In our analysis of SBA statistics, we included an evaluation of franchise loans in the state. This included evaluating the number of franchise SBA loans made from 2010 to 2018. It also included reviewing the top franchises in terms of SBA loan originations for the same time period.
If you’re interested in evaluating franchise success and failure rates, in a separate study, we evaluated the 50 best and 50 worst franchises by SBA default rate.
The SBA statistics on franchises included in our analysis by state are:
- Number of franchise SBA loans made from 2010 to 2018: The number of franchise loans is based on the number of SBA loans that went to finance franchises in the state throughout the time period from 2010 through 2018, as determined from data provided from the Small Business Administration.
- Top franchise by state based on loans originated from 2010 to 2018: The top franchise for each state was identified based on SBA data for the time period from 2010 through 2018. The identified franchise received the greatest number of SBA loans during that time period.
SBA Statistics By State
As noted, we have compiled numerous SBA loan statistics and small business industry statistics for each state, and U.S. territory. These statistics include the SBA lender for each state, the total dollar amount of SBA loans provided to the state, and the average interest rate and loan terms.
Additional statistical information is provided for each state regarding the top small business employment industries, the number of entities, and the number of people employed in those sectors. Further data detailing the number of people that are employed by small businesses within the state, and broken down into small business size (based on number of employees) is also provided. The number of SBA loan applications was not considered.
The SBA loan statistics and general small business industry statistics for each state are:
1. Alabama SBA Statistics and Small Business Industry Statistics
As of 2016, small businesses employed 789,425 people in the state of Alabama. Over $154 million in SBA loan funds went to small businesses in Alabama in 2018 alone. The leading industry supported with SBA loan funds between 2010 and 2018 was the accommodation and food service industry, which received 552 loans, and is one of the top three small business industries in the state. The top franchise financed by SBA loans in Alabama was Quality Inn & Suites.
The SBA loan statistics and other small business industry statistics we evaluated for Alabama are:
Alabama SBA Loan Statistics
The primary SBA loan statistics for the state of Alabama are:
- Top SBA Lender: Wells Fargo
- Number of SBA Loans Approved in 2018: 390
- Total Dollar Amount of SBA Loans Approved in 2018: $154,680,382
- Average Interest Rate of SBA Loans Made in 2018: 7.8%
- Average Loan Term for SBA Loans Made in 2018: 13 Years
- Average Default Rate of SBA Loans from 2010 to 2018: 15.1%
Wells Fargo, a national lender, is first on the list of top 100 SBA lenders for 2018 in the state of Alabama. Notably, Wells Fargo originated 57 loans totaling $1,083,500 in the state of Alabama in fiscal year 2018. This represented 14.6% of the total number of SBA loans made in the state.
Alabama Small Business Industry Statistics
The three NAICS codes for small businesses employing the largest number of people in Alabama, and the number of SBA loans made in those industries are:
| Ranking |
|
|
|
|
|---|---|---|---|---|
| 1 |
|
|
|
|
| 2 |
|
|
|
|
| 3 |
|
|
|
|
Alabama Small Business Employment Statistics
The number of people employed by small businesses in Alabama, and the number of jobs supported by SBA loans are:
- Number of People in Alabama Employed by Small Businesses: 789,425
- Number of Jobs Supported by SBA Loans from 2010 to 2018: 40,913
- Percent of Jobs Supported by SBA Loans from 2010 to 2018: 5.2%
- Number of Jobs Supported by SBA Loans in 2018: 4,211
- Percent of Jobs Supported by SBA Loans in 2018: 0.5%
SBA loan funds helped support roughly 5% of the jobs created by small businesses in the state of Alabama from 2010 to 2018.
Number of People in Alabama Employed by Small Businesses

Source: SBA & SUSB Data
Alabama SBA Franchise Loan Statistics
The SBA loan statistics for franchise financing in Alabama from 2010 to 2018 are:
- Number of SBA Franchise Loans Made from 2010 to 2018: 390
- Top Franchise Funded by SBA Loans in Alabama: Quality Inn & Suites
Of the 390 SBA franchise loans made in Alabama between 2010 and 2018, 17 loans went to borrowers financing a Quality Inn & Suites franchise. Quality Inn & Suites was not in the list of the top 50 or bottom 50 franchises as determined by SBA loan default rates from 2010 to 2018.
2. Alaska SBA Statistics and Small Business Industry Statistics
As of 2016, small businesses employed 141,147 people in the state of Alaska. Nearly $62 million in SBA loan funds went to small businesses in Alaska in 2018 alone. The leading industry supported with SBA loan funds between 2010 and 2018 was the accommodation and food service industry, which received 140 loans, and is one of the top three small business industries in the state. The top franchise financed by SBA loans in Alaska was Ameriprise Financial.
The SBA loan statistics and other small business industry statistics we evaluated for Alaska are:
Alaska SBA Loan Statistics
The primary SBA loan statistics for the state of Alaska are:
- Top SBA Lender: Wells Fargo
- Total Dollar Amount of SBA Loans Approved in 2018: $61,896,228
- Number of SBA Loans Approved in 2018: 105
- Average Interest Rate of SBA Loans Made in 2018: 8.4%
- Average Loan Term for SBA Loans Made in 2018: 15 Years
- Average Default Rate of SBA Loans from 2010 to 2018: 12.5%
Wells Fargo the top lender for SBA loans in Alaska in 2018, and was also the top SBA lender nationally for the same time period. Wells Fargo originated 35 loans totaling $11,716,975 in the state of Alaska in fiscal year 2018. This represented 33% of the total number of SBA loans made in the state.
Alaska Small Business Industry Statistics
The three NAICS codes for small businesses employing the largest number of people in Alaska, and the number of SBA loans made in those industries are:
| Ranking |
|
|
|
|
|---|---|---|---|---|
| 1 |
|
|
|
|
| 2 |
|
|
|
|
| 3 |
|
|
|
|
Alaska Small Business Employment Statistics
The number of people employed by small businesses in Alaska, and the number of jobs supported by SBA loans are:
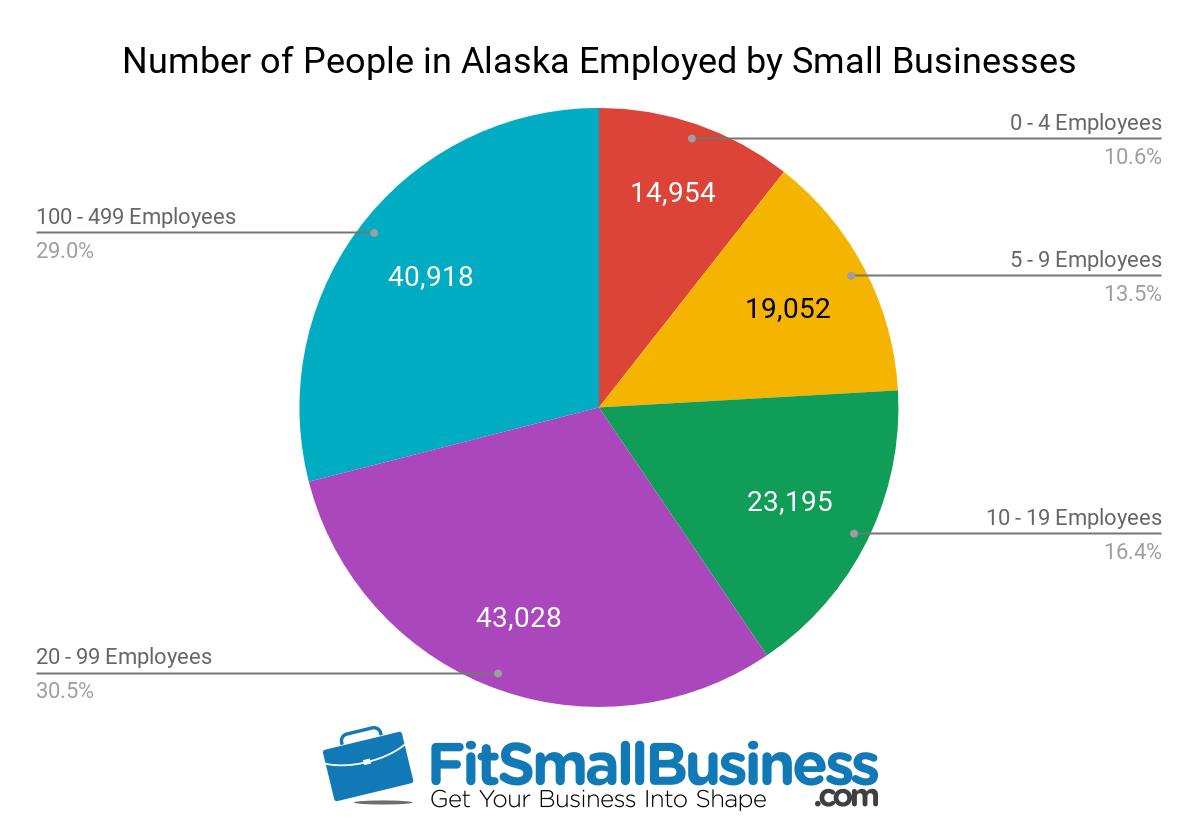
- Number of People in Alaska Employed by Small Businesses: 141,147
- Number of Jobs Supported by SBA Loans from 2010 to 2018: 15,086
- Percent of Jobs Supported by SBA Loans from 2010 to 2018: 10.7%
- Number of Jobs Supported by SBA Loans in 2018: 1,584
- Percent of Jobs Supported by SBA Loans in 2018: 1.1%
SBA loan funds helped support roughly 11% of the jobs created by small businesses in the state of Alaska from 2010 to 2018.
Number of People in Alaska Employed by Small Businesses
Source: SBA & SUSB Data
Alaska SBA Franchise Loan Statistics
The SBA loan statistics for franchise financing in Alaska from 2010 to 2018 are:
- Number of SBA Franchise Loans Made from 2010 to 2018: 46
- Top Franchise Funded by SBA Loans in Alaska: Ameriprise Financial
Of the 46 SBA franchise loans made in Alaska between 2010 and 2018, four loans went to borrowers financing an Ameriprise Financial franchise. Ameriprise Financial was not in the list of the top 50 or bottom 50 franchises as determined by SBA loan default rates from 2010 to 2018.
3. Arizona SBA Statistics and Small Business Industry Statistics
As of 2016, small businesses employed 1,039,228 people in the state of Arizona. Nearly $444 million in SBA loan funds went to small businesses in Arizona in 2018 alone. The leading industry supported with SBA loan funds between 2010 and 2018 was the healthcare and social assistance industry, which received 1,457 loans, and is one of the top three small business industries in the state. The top franchise financed by SBA loans in Arizona was European Wax Center.
The SBA loan statistics and other small business industry statistics we evaluated for Arizona are:
Arizona SBA Loan Statistics
The primary SBA loan statistics for the state of Arizona are:
- Top SBA Lender: Wells Fargo
- Number of SBA Loans Approved in 2018: 1,160
- Total Dollar Amount of SBA Loans Approved in 2018: $443,802,720
- Average Interest Rate of SBA Loans Made in 2018: 8.0%
- Average Loan Term for SBA Loans Made in 2018: 13 Years
- Average Default Rate of SBA Loans from 2010 to 2018: 13.3%
During 2018, the top SBA lender in Arizona was Wells Fargo. This is not surprising since Wells Fargo is also the top 100 SBA lender nationally. Wells Fargo originated 134 loans totaling $34,963,950 in the state of Arizona in fiscal year 2018. This represented 11.6% of the total number of SBA loans made in the state.
Arizona Small Business Industry Statistics
The three NAICS codes for small businesses employing the largest number of people in Arizona, and the number of SBA loans made in those industries are:
| Ranking |
|
|
|
|
|---|---|---|---|---|
| 1 |
|
|
|
|
| 2 | 72 - Accommodation
|
|
|
|
| 3 |
|
|
|
|
Arizona Small Business Employment Statistics
The number of people employed by small businesses in Arizona, and the number of jobs supported by SBA loans are:
- Number of People in Arizona Employed by Small Businesses: 1,039,228
- Number of Jobs Supported by SBA Loans from 2010 to 2018: 143,991
- Percent of Jobs Supported by SBA Loans from 2010 to 2018: 13.9%
- Number of Jobs Supported by SBA Loans in 2018: 14,198
- Percent of Jobs Supported by SBA Loans in 2018: 1.4%
SBA loan funds helped support roughly 14% of the jobs created by small businesses in the state of Arizona from 2010 to 2018.
Number of People in Arizona Employed by Small Businesses

Source: SBA & SUSB Data
Arizona SBA Franchise Loan Statistics
The SBA loan statistics for franchise financing in Arizona from 2010 to 2018 are:
- Number of SBA Franchise Loans Made from 2010 to 2018: 732
- Top Franchise Funded by SBA Loans in Arizona: European Wax Center
Of the 732 SBA franchise loans made in Arizona between 2010 and 2018, 22 loans went to borrowers financing a European Wax Center franchise. European Wax Center was not in the list of the top 50 or bottom 50 franchises as determined by SBA loan default rates from 2010 to 2018.
4. Arkansas SBA Statistics and Small Business Industry Statistics
As of 2016, small businesses employed 490,497 people in the state of Arkansas. Nearly $202 million in SBA loan funds went to small businesses in Arkansas in 2018 alone. The leading industry supported with SBA loan funds between 2010 and 2018 was the agriculture and forestry industry, which received 697 loans. However, the agriculture and forest industry is not one of the top three small business industries in the state. The top franchise financed by SBA loans in Arkansas was Firehouse Subs.
The SBA loan statistics and other small business industry statistics we evaluated for Arkansas are:
Arkansas SBA Loan Statistics
The primary SBA loan statistics for the state of Arkansas are:
- Top SBA Lender: Arvest Bank
- Number of SBA Loans Approved in 2018: 352
- Total Dollar Amount of SBA Loans Approved in 2018: $201,801,798
- Average Interest Rate of SBA Loans Made in 2018: 7.5%
- Average Loan Term for SBA Loans Made in 2018: 13 Years
- Average Default Rate of SBA Loans from 2010 to 2018: 12.6%
Arvest Bank is one of the top 100 SBA lenders for 2018. Arvest Bank originated 64 loans totaling $16,046,000 in the state of Arkansas in fiscal year 2018. This represented 18.2% of the total number of SBA loans made in the state.
Arkansas Small Business Industry Statistics
The three NAICS codes for small businesses employing the largest number of people in Arkansas, and the number of SBA loans made in those industries are:
| Ranking |
|
|
|
|
|---|---|---|---|---|
| 1 |
|
|
|
|
| 2 |
|
|
|
|
| 3 |
|
|
|
|
| 16 |
|
|
|
|
Arkansas Small Business Employment Statistics
The number of people employed by small businesses in Arkansas, and the number of jobs supported by SBA loans are:
- Number of People in Arkansas Employed by Small Businesses: 490,497
- Number of Jobs Supported by SBA Loans from 2010 to 2018: 24,850
- Percent of Jobs Supported by SBA Loans from 2010 to 2018: 5.1%
- Number of Jobs Supported by SBA Loans in 2018: 3,778
- Percent of Jobs Supported by SBA Loans in 2018: 0.77%
SBA loan funds helped support roughly 5% of the jobs created by small businesses in the state of Arkansas from 2010 to 2018.
Number of People in Arkansas Employed by Small Businesses

Source: SBA & SUSB Data
Arkansas SBA Franchise Loan Statistics
The SBA loan statistics for franchise financing in Arkansas from 2010 to 2018 are:
- Number of SBA Franchise Loans Made from 2010 to 2018: 187
- Top Franchise Funded by SBA Loans in Arkansas: Firehouse Subs
Of the 187 SBA franchise loans made in Arkansas between 2010 and 2018, seven loans went to borrowers financing a Firehouse Subs franchise. Firehouse Subs was not in the list of the top 50 or bottom 50 franchises as determined by SBA loan default rates from 2010 to 2018.
5. California SBA Statistics and Small Business Industry Statistics
As of 2016, small businesses employed 7,129,204 people in the state of California. Over $4 billion in SBA loan funds went to small businesses in California in 2018 alone. The leading industry supported with SBA loan funds between 2010 and 2018 was the accommodation and food service industry, which received 8,163 loans, and is one of the top three small business industries in the state. The top franchise financed by SBA loans in California was Chevron Gas Station.
The SBA loan statistics and other small business industry statistics we evaluated for California are:
California SBA Loan Statistics
The primary SBA loan statistics for the state of California are:
- Top SBA Lender: Wells Fargo
- Number of SBA Loans Approved in 2018: 7,285
- Total Dollar Amount of SBA Loans Approved in 2018: $4,058,718,715
- Average Interest Rate of SBA Loans Made in 2018: 7.8%
- Average Loan Term for SBA Loans Made in 2018: 13 Years
- Average Default Rate of SBA Loans from 2010 to 2018: 13.9%
For 2018, Wells Fargo was the top 100 SBA lender in California. This does not come as a surprise, since Wells Fargo it the top national lender and is headquartered in San Francisco, California. Wells Fargo originated 870 loans totaling $249,676,085 in the state of California in fiscal year 2018. This represented 11.9% of the total number of SBA loans made in the state.
California Small Business Industry Statistics
The three NAICS codes for small businesses employing the largest number of people in California, and the number of SBA loans made in those industries are:
| Ranking |
|
|
|
|
|---|---|---|---|---|
| 1 |
|
|
|
|
| 2 |
|
|
|
|
| 3 |
|
|
|
|
California Small Business Employment Statistics
The number of people employed by small businesses in California, and the number of jobs supported by SBA loans are:
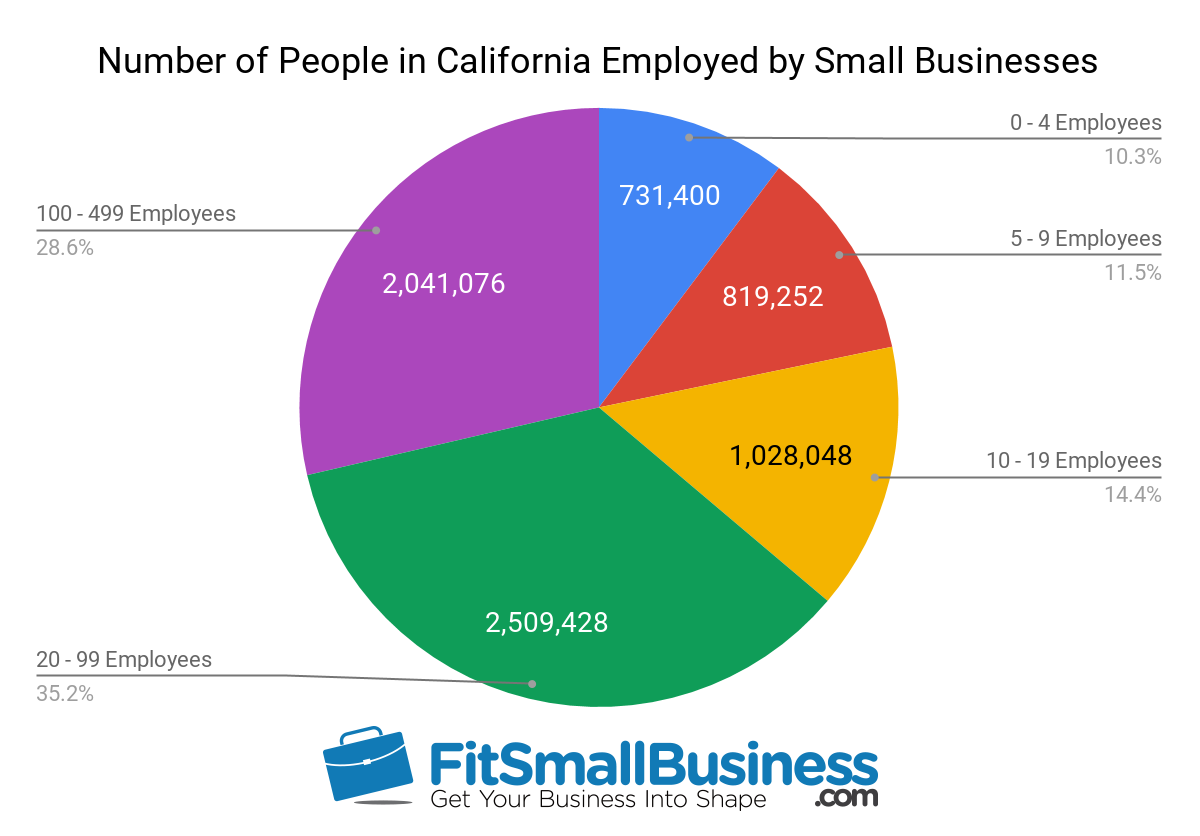
- Number of People in California Employed by Small Businesses: 7,129,204
- Number of Jobs Supported by SBA Loans from 2010 to 2018: 730,931
- Percent of Jobs Supported by SBA Loans from 2010 to 2018: 10.3%
- Number of Jobs Supported by SBA Loans in 2018: 77,375
- Percent of Jobs Supported by SBA Loans in 2018: 1.1%
SBA loan funds helped support roughly 10% of the jobs created by small businesses in the state of California from 2010 to 2018.
Number of People in California Employed by Small Businesses
Source: SBA & SUSB Data
California SBA Franchise Loan Statistics
The SBA loan statistics for franchise financing in California from 2010 to 2018 are:
- Number of SBA Franchise Loans Made from 2010 to 2018: 3,262
- Top Franchise Funded by SBA Loans in California: Chevron Gas Station
Of the 3,262 SBA franchise loans made in California between 2010 and 2018, 92 loans went to borrowers financing a Chevron Gas Station franchise. Chevron Gas Station was not in the list of the top 50 or bottom 50 franchises as determined by SBA loan default rates from 2010 to 2018.
6. Colorado SBA Statistics and Small Business Industry Statistics
As of 2016, small businesses employed 1,117,202 people in the state of Colorado. Nearly $736 million in SBA loan funds went to small businesses in Colorado in 2018 alone. The leading industry supported with SBA loan funds between 2010 and 2018 was the professional, scientific and technical services industry, which received 1,560 loans. However, the professional, scientific and technical services industry is not one of the top three small business industries in the state. The top franchise financed by SBA loans in Colorado was Jimmy John’s.
The SBA loan statistics and other small business industry statistics we evaluated for Colorado are:
Colorado SBA Loan Statistics
The primary SBA loan statistics for the state of Colorado are:
- Top SBA Lender: Wells Fargo
- Number of SBA Loans Approved in 2018: 1,436
- Total Dollar Amount of SBA Loans Approved in 2018: $735,937,113
- Average Interest Rate of SBA Loans Made in 2018: 7.9%
- Average Loan Term for SBA Loans Made in 2018: 13 Years
- Average Default Rate of SBA Loans from 2010 to 2018: 13.0%
Not surprising as it’s the top SBA lender nationally, Wells Fargo originated the most SBA loans in Colorado in 2018. Wells Fargo originated 239 loans totaling $68,361,590 in the state of Colorado in fiscal year 2018. This represented 16.6% of the total number of SBA loans made in the state.
Colorado Small Business Industry Statistics
The three NAICS codes for small businesses employing the largest number of people in Colorado, and the number of SBA loans made in those industries are:
| Ranking |
|
|
|
|
|---|---|---|---|---|
| 1 |
|
|
|
|
| 2 |
|
|
|
|
| 3 |
|
|
|
|
Colorado Small Business Employment Statistics
The number of people employed by small businesses in Colorado, and the number of jobs supported by SBA loans are:
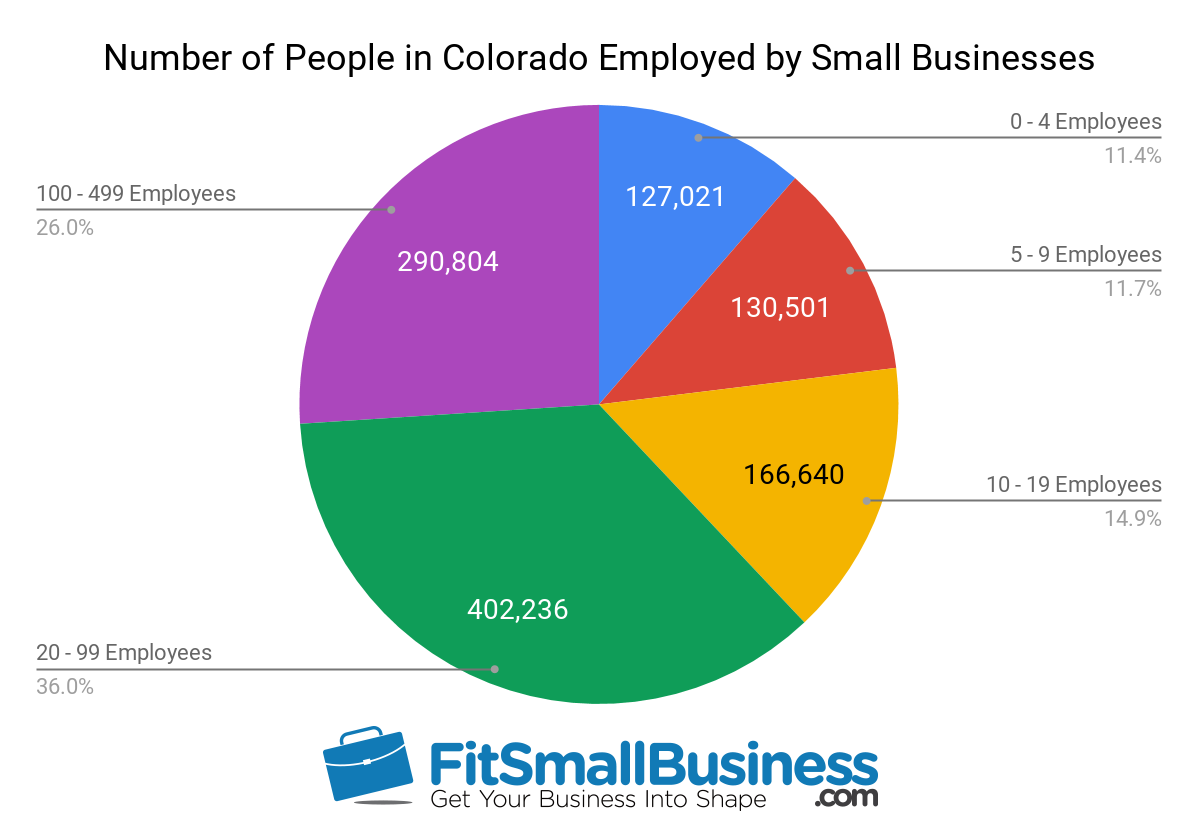
- Number of People in Colorado Employed by Small Businesses: 1,117,202
- Number of Jobs Supported by SBA Loans from 2010 to 2018: 138,023
- Percent of Jobs Supported by SBA Loans from 2010 to 2018: 12.4%
- Number of Jobs Supported by SBA Loans in 2018: 14,856
- Percent of Jobs Supported by SBA Loans in 2018: 1.3%
SBA loan funds helped support roughly 12% of the jobs created by small businesses in the state of Colorado from 2010 to 2018.
Number of People in Colorado Employed by Small Businesses
Source: SBA & SUSB Data
Colorado SBA Franchise Loan Statistics
The SBA loan statistics for franchise financing in Colorado from 2010 to 2018 are:
- Number of SBA Franchise Loans Made from 2010 to 2018: 790
- Top Franchise Funded by SBA Loans in Colorado: Jimmy John’s
Of the 790 SBA franchise loans made in Colorado between 2010 and 2018, 16 loans went to borrowers financing a Jimmy John’s franchise. Jimmy John’s was in the list of the top 50 franchises as determined by SBA loan default rates from 2010 to 2018.
7. Connecticut SBA Statistics and Small Business Industry Statistics
As of 2016, small businesses employed 750,457 people in the state of Connecticut. Over $153 million in SBA loan funds went to small businesses in Connecticut in 2018 alone. The leading industry supported with SBA loan funds between 2010 and 2018 was the construction industry, which received 669 loans. However, the construction industry is not one of the top three small business industries in the state. The top franchise financed by SBA loans in Connecticut was Sport Clips.
The SBA loan statistics and other small business industry statistics we evaluated for Connecticut are:
Connecticut SBA Loan Statistics
The primary SBA loan statistics for the state of Connecticut are:
- Top SBA Lender: TD Bank
- Number of SBA Loans Approved in 2018: 739
- Total Dollar Amount of SBA Loans Approved in 2018: $153,126,426
- Average Interest Rate of SBA Loans Made in 2018: 8.3%
- Average Loan Term for SBA Loans Made in 2018: 11 Years
- Average Default Rate of SBA Loans from 2010 to 2018: 14.4%
During 2018, TD Bank, a regional bank serving the East Coast, was the top lender for Connecticut. Additionally, TD Bank is one of the top 100 SBA lenders for 2018. TD Bank originated 113 loans totaling $5,884,925 in the state of Connecticut in fiscal year 2018. This represented 15.3% of the total number of SBA loans made in the state.
Connecticut Small Business Industry Statistics
The three NAICS codes for small businesses employing the largest number of people in Connecticut, and the number of SBA loans made in those industries are:
| Ranking |
|
|
|
|
|---|---|---|---|---|
| 1 |
|
|
|
|
| 2 |
|
|
|
|
| 3 |
|
|
|
|
| 7 |
|
|
|
|
Connecticut Small Business Employment Statistics
The number of people employed by small businesses in Connecticut, and the number of jobs supported by SBA loans are:
- Number of People in Connecticut Employed by Small Businesses: 750,457
- Number of Jobs Supported by SBA Loans from 2010 to 2018: 55,024
- Percent of Jobs Supported by SBA Loans from 2010 to 2018: 7.3%
- Number of Jobs Supported by SBA Loans in 2018: 5,649
- Percent of Jobs Supported by SBA Loans in 2018: 0.75%
SBA loan funds helped support roughly 7% of the jobs created by small businesses in the state of Connecticut from 2010 to 2018.
Number of People in Connecticut Employed by Small Businesses

Source: SBA & SUSB Data
Connecticut SBA Franchise Loan Statistics
The SBA loan statistics for franchise financing in Connecticut from 2010 to 2018 are:
- Number of SBA Franchise Loans Made from 2010 to 2018: 327
- Top Franchise Funded by SBA Loans in Connecticut: Sport Clips
Of the 327 SBA franchise loans made in Connecticut between 2010 and 2018, 11 loans went to borrowers financing a Sport Clips franchise.
8. Delaware SBA Statistics and Small Business Industry Statistics
As of 2016, small businesses employed 187,556 people in the state of Delaware. Nearly $49 million in SBA loan funds went to small businesses in Delaware in 2018 alone. The leading industry supported with SBA loan funds between 2010 and 2018 was the accommodation and food service industry, which received 170 loans, and is one of the top three small business industries in the state. The top franchise financed by SBA loans in Delaware was Papa John’s Pizza.
The SBA loan statistics and other small business industry statistics we evaluated for Delaware are:
Delaware SBA Loan Statistics
The primary SBA loan statistics for the state of Delaware are:
- Top SBA Lender: Manufacturers and Traders Trust Company
- Number of SBA Loans Approved in 2018: 187
- Total Dollar Amount of SBA Loans Approved in 2018: $48,846,925
- Average Interest Rate of SBA Loans Made in 2018: 9.7%
- Average Loan Term for SBA Loans Made in 2018: 12 Years
- Average Default Rate of SBA Loans from 2010 to 2018: 12.7%
Manufacturers and Traders Trust Company, an East Coast regional lender, is one of the top 100 SBA lenders. Manufacturers and Traders Trust Company originated 58 loans totaling $5,632,075 in the state of Delaware in fiscal year 2018. This represented 31% of the total number of SBA loans made in the state.
Delaware Small Business Industry Statistics
The three NAICS codes for small businesses employing the largest number of people in Delaware, and the number of SBA loans made in those industries are:
| Ranking |
|
|
|
|
|---|---|---|---|---|
| 1 |
|
|
|
|
| 2 |
|
|
|
|
| 3 |
|
|
|
|
Delaware Small Business Employment Statistics
The number of people employed by small businesses in Delaware, and the number of jobs supported by SBA loans are:
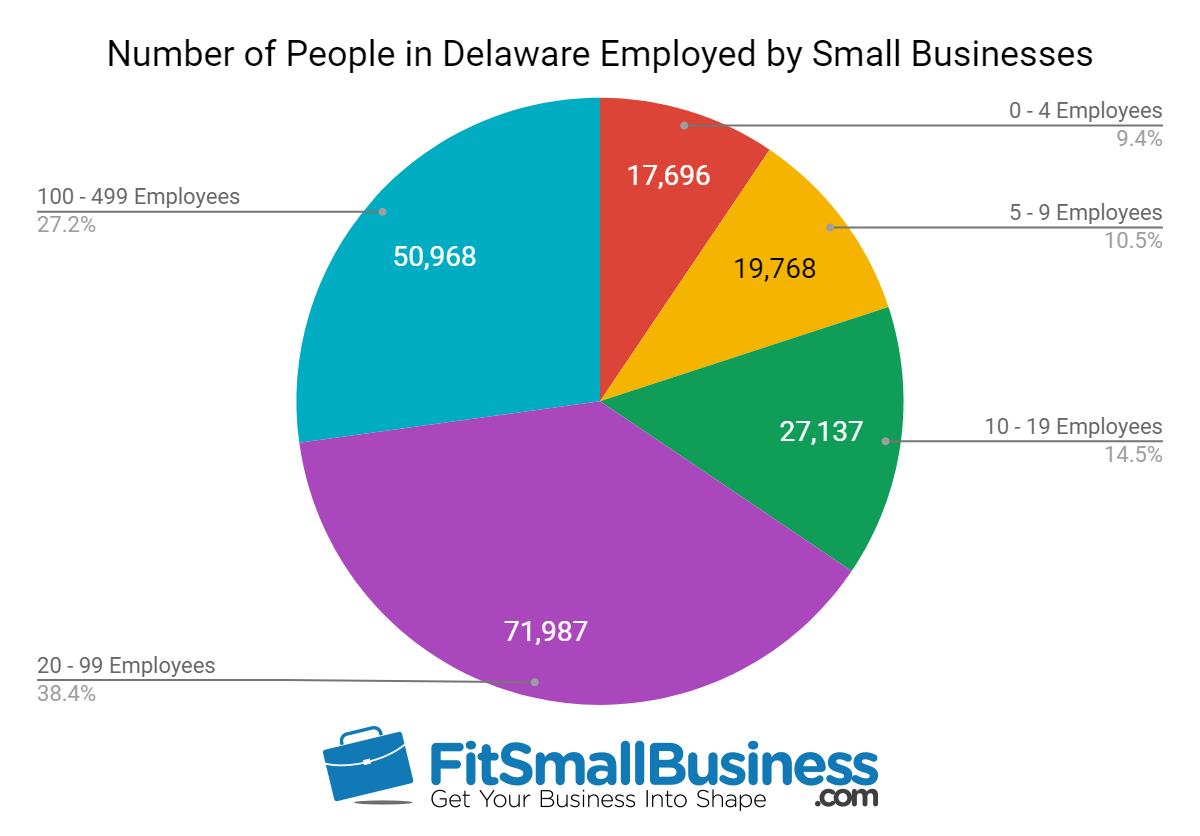
- Number of People in Delaware Employed by Small Businesses: 187,556
- Number of Jobs Supported by SBA Loans from 2010 to 2018: 12,912
- Percent of Jobs Supported by SBA Loans from 2010 to 2018: 6.9%
- Number of Jobs Supported by SBA Loans in 2018: 2,079
- Percent of Jobs Supported by SBA Loans in 2018: 1.1%
SBA loan funds helped support roughly 7% of the jobs created by small businesses in the state of Delaware from 2010 to 2018.
Number of People in Delaware Employed by Small Businesses
Source: SBA & SUSB Data
Delaware SBA Franchise Loan Statistics
The SBA loan statistics for franchise financing in Delaware from 2010 to 2018 are:
- Number of SBA Franchise Loans Made from 2010 to 2018: 103
- Top Franchise Funded by SBA Loans in Delaware: Papa John’s Pizza
Of the 103 SBA franchise loans made in Delaware between 2010 and 2018, five loans went to borrowers financing a Papa John’s franchise.
9. District of Columbia SBA Statistics and Small Business Industry Statistics
As of 2016, small businesses employed 247,461 people in the state of the District of Columbia. Nearly $37 million in SBA loan funds went to small businesses in the District of Columbia in 2018 alone. The leading industry supported with SBA loan funds between 2010 and 2018 was the accommodation and food service industry, which received 185 loans, and is one of the top three small business industries in the state. The top franchise financed by SBA loans in the District of Columbia was Barre3.
The SBA loan statistics and other small business industry statistics we evaluated for the District of Columbia are:
District of Columbia SBA Loan Statistics
The primary SBA loan statistics for the District of Columbia are:
- Top SBA Lender: TD Bank
- Number of SBA Loans Approved in 2018: 120
- Total Dollar Amount of SBA Loans Approved in 2018: $36,551,225
- Average Interest Rate of SBA Loans Made in 2018: 8.6%
- Average Loan Term for SBA Loans Made in 2018: 11 Years
- Average Default Rate of SBA Loans from 2010 to 2018: 16.5%
The top SBA lender for the District of Columbia in 2018 was TD Bank, an East Coast bank that’s also one of the top SBA lenders nationally. TD Bank originated 25 loans totaling $827,500 in the District of Columbia in fiscal year 2018. This represented 20.8% of the total number of SBA loans made in the state.
District of Columbia Small Business Industry Statistics
The three NAICS codes for small businesses employing the largest number of people in the District of Columbia, and the number of SBA loans made in those industries are:
| Ranking |
|
|
|
|
|---|---|---|---|---|
| 1 |
|
|
|
|
| 2 |
|
|
|
|
| 3 |
|
|
|
|
District of Columbia Small Business Employment Statistics
The number of people employed by small businesses in the District of Columbia, and the number of jobs supported by SBA loans are:
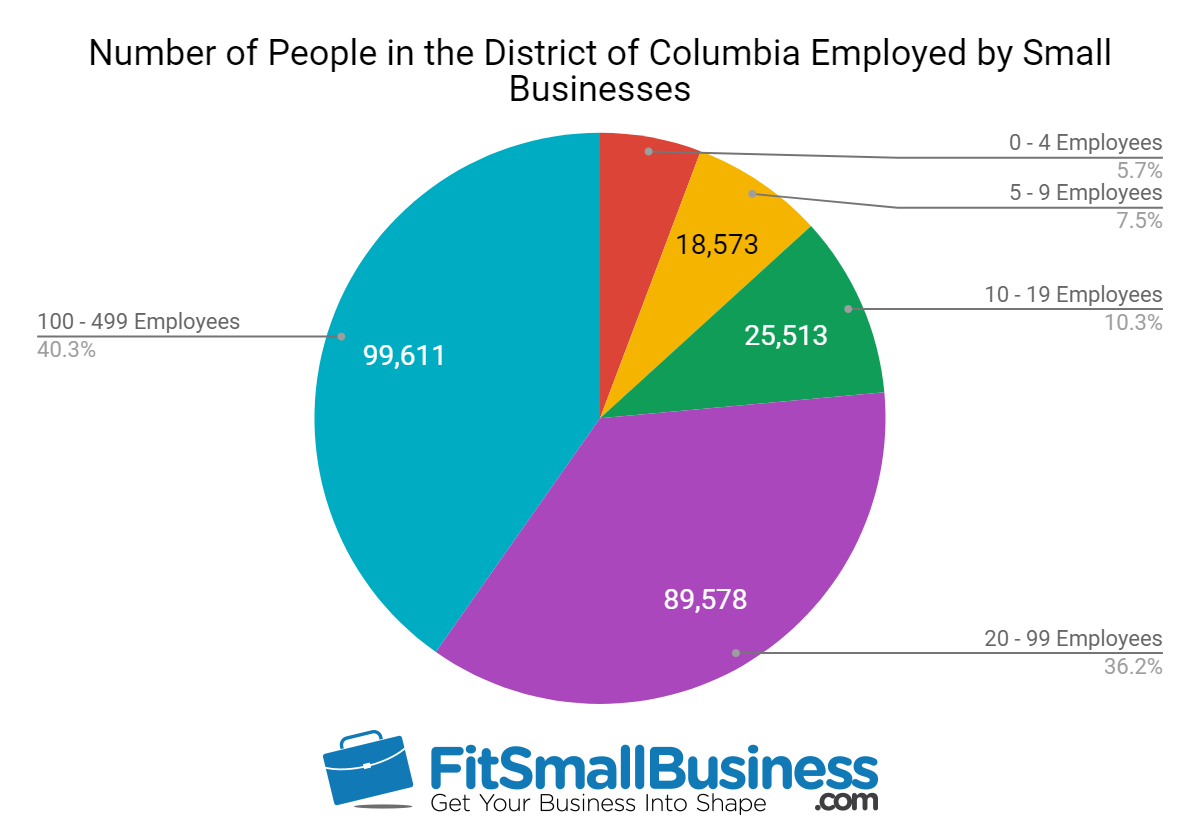
- Number of People in the District of Columbia Employed by Small Businesses: 247,461
- Number of Jobs Supported by SBA Loans from 2010 to 2018: 11,603
- Percent of Jobs Supported by SBA Loans from 2010 to 2018: 4.7%
- Number of Jobs Supported by SBA Loans in 2018: 1,931
- Percent of Jobs Supported by SBA Loans in 2018: 0.8%
SBA loan funds helped support roughly 5% of the jobs created by small businesses in the District of Columbia from 2010 to 2018.
Number of People in the District of Columbia Employed by Small Businesses
Source: SBA & SUSB Data
District of Columbia SBA Franchise Loan Statistics
The SBA loan statistics for franchise financing in the District of Columbia from 2010 to 2018 are:
- Number of SBA Franchise Loans Made from 2010 to 2018: 44
- Top Franchise Funded by SBA Loans in the District of Columbia: Barre3
Of the 44 SBA franchise loans made in the District of Columbia between 2010 and 2018, five loans went to borrowers financing a Barre3 fitness franchise.
10. Florida SBA Statistics and Small Business Industry Statistics
As of 2016, small businesses employed 3,397,931 people in the state of Florida. Nearly $1.3 billion in SBA loan funds went to small businesses in Florida in 2018 alone. The leading industry supported with SBA loan funds between 2010 and 2018 was the healthcare and social assistance industry, which received 2,857 loans, and is one of the top three small business industries in the state. The top franchise financed by SBA loans in Florida was Jimmy John’s.
The SBA loan statistics and other small business industry statistics we evaluated for Florida are:
Florida SBA Loan Statistics
The primary SBA loan statistics for the state of Florida are:
- Top SBA Lender: TD Bank
- Number of SBA Loans Approved in 2018: 3,694
- Total Dollar Amount of SBA Loans Approved in 2018: $1,264,592,706
- Average Interest Rate of SBA Loans Made in 2018: 8.4%
- Average Loan Term for SBA Loans Made in 2018: 12 Years
- Average Default Rate of SBA Loans from 2010 to 2018: 12.8%
For the year 2018, TD Bank provided the most SBA loans. This is not surprising as TD Bank has a large presence on the East Coast and is one of the top SBA lenders nationally. TD Bank originated 817 loans totaling $37,859,759 in the state of Florida in fiscal year 2018. This represented 22.1% of the total number of SBA loans made in the state.
Florida Small Business Industry Statistics
The three NAICS codes for small businesses employing the largest number of people in Florida, and the number of SBA loans made in those industries are:
| Ranking |
|
|
|
|
|---|---|---|---|---|
| 1 |
|
|
|
|
| 2 |
|
|
|
|
| 3 |
|
|
|
|
Florida Small Business Employment Statistics
The number of people employed by small businesses in Florida, and the number of jobs supported by SBA loans are:
- Number of People in Florida Employed by Small Businesses: 3,397,931
- Number of Jobs Supported by SBA Loans from 2010 to 2018: 260,876
- Percent of Jobs Supported by SBA Loans from 2010 to 2018: 7.7%
- Number of Jobs Supported by SBA Loans in 2018: 36,747
- Percent of Jobs Supported by SBA Loans in 2018: 1.1%
SBA loan funds helped support roughly 8% of the jobs created by small businesses in the state of Florida from 2010 to 2018.
Number of People in Florida Employed by Small Businesses
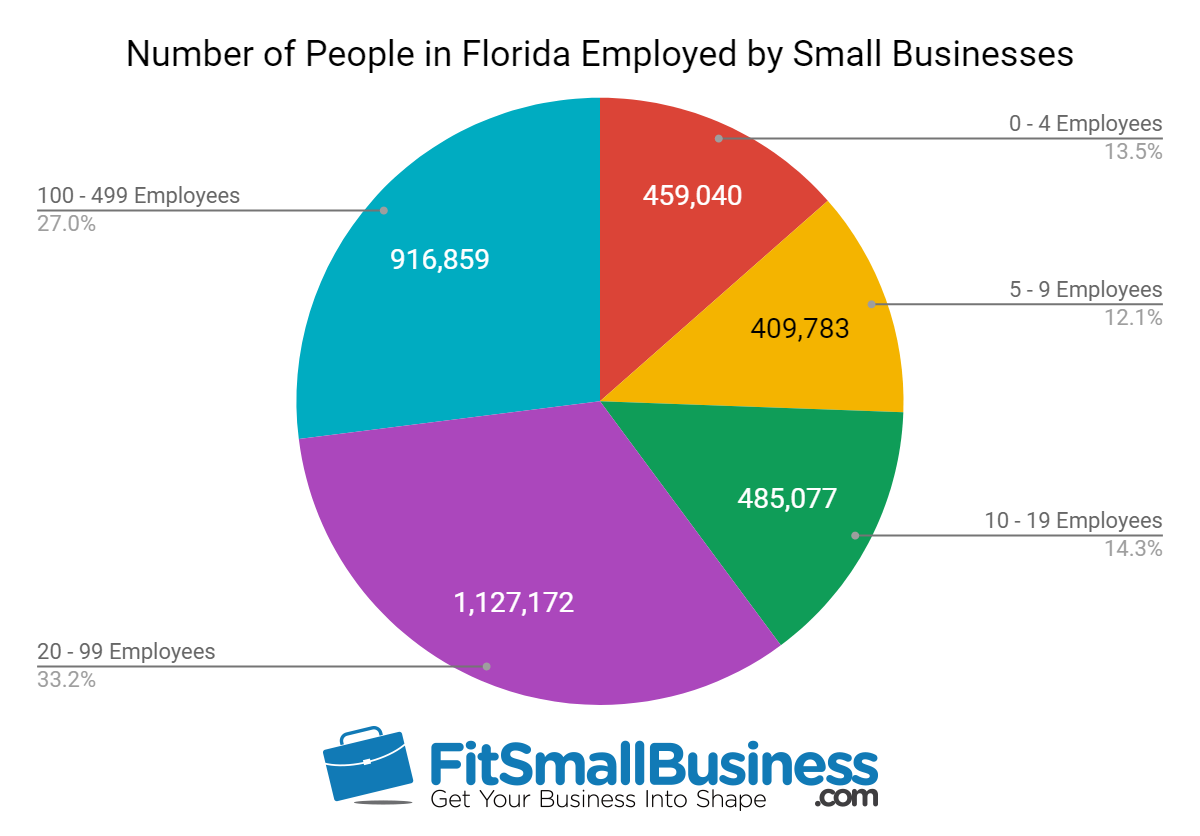
Source: SBA & SUSB Data
Florida SBA Franchise Loan Statistics
The SBA loan statistics for franchise financing in the Florida from 2010 to 2018 are:
- Number of SBA Franchise Loans Made from 2010 to 2018: 1,801
- Top Franchise Funded by SBA Loans in Florida: Jimmy John’s
Of the 1,801 SBA franchise loans made in Florida between 2010 and 2018, 38 loans went to borrowers financing a Jimmy John’s franchise. Jimmy John’s was in the list of the top 50 franchises as determined by SBA loan default rates from 2010 to 2018.
11. Georgia SBA Statistics and Small Business Industry Statistics
As of 2016, small businesses employed 1,637,892 people in the state of Georgia. Over $943 million in SBA loan funds went to small businesses in Georgia in 2018 alone. The leading industry supported with SBA loan funds between 2010 and 2018 was the accommodation and food service industry, which received 2,305 loans, and is one of the top three small business industries in the state. The top franchise financed by SBA loans in Georgia was Marco’s Pizza.
The SBA loan statistics and other small business industry statistics we evaluated for Georgia are:
Georgia SBA Loan Statistics
The primary SBA loan statistics for the state of Georgia are:
- Top SBA Lender: Wells Fargo
- Number of SBA Loans Approved in 2018: 1,730
- Total Dollar Amount of SBA Loans Approved in 2018: $943,159,725
- Average Interest Rate of SBA Loans Made in 2018: 7.5%
- Average Loan Term for SBA Loans Made in 2018: 15 Years
- Average Default Rate of SBA Loans from 2010 to 2018: 13.4%
As with several other states, Wells Fargo was the top SBA lender in Georgia for the year 2018. The company also tops the list of SBA loan originations nationally for the same year. Wells Fargo originated 199 loans totaling $35,988,240 in the state of Georgia in fiscal year 2018. This represented 11.5% of the total number of SBA loans made in the state.
Georgia Small Business Industry Statistics
The three NAICS codes for small businesses employing the largest number of people in Georgia, and the number of SBA loans made in those industries are:
| Ranking |
|
|
|
|
|---|---|---|---|---|
| 1 |
|
|
|
|
| 2 |
|
|
|
|
| 3 |
|
|
|
|
Georgia Small Business Employment Statistics
The number of people employed by small businesses in Georgia, and the number of jobs supported by SBA loans are:
- Number of People in Georgia Employed by Small Businesses: 1,637,892
- Number of Jobs Supported by SBA Loans from 2010 to 2018: 164,124
- Percent of Jobs Supported by SBA Loans from 2010 to 2018: 10.0%
- Number of Jobs Supported by SBA Loans in 2018: 18,182
- Percent of Jobs Supported by SBA Loans in 2018: 1.1%
SBA loan funds helped support roughly 10% of the jobs created by small businesses in the state of Georgia from 2010 to 2018.
Number of People in Georgia Employed by Small Businesses

Source: SBA & SUSB Data
Georgia SBA Franchise Loan Statistics
The SBA loan statistics for franchise financing in Georgia from 2010 to 2018 are:
- Number of SBA Franchise Loans Made from 2010 to 2018: 1,574
- Top Franchise Funded by SBA Loans in Georgia: Marco’s Pizza
Of the 1,574 SBA franchise loans made in Georgia between 2010 and 2018, 50 loans went to borrowers financing a Marco’s Pizza franchise.
12. Guam SBA Statistics and Small Business Industry Statistics
As of 2016, small businesses employed 51,717 people in Guam. Nearly $4 million in SBA loan funds went to small businesses in Guam in 2018 alone. The leading industry supported with SBA loan funds between 2010 and 2018 was the construction industry, which received 80 loans. However, the construction industry is not one of the top three small business industries in Guam. The top franchise financed by SBA loans in Guam was Mathnasium Learning Center.
The SBA loan statistics and other small business industry statistics we evaluated for Guam are:
Guam SBA Loan Statistics
The primary SBA loan statistics for the state of Guam are:
- Top SBA Lender: Coast360 FCU
- Number of SBA Loans Approved in 2018: 18
- Total Dollar Amount of SBA Loans Approved in 2018: $3,653,800
- Average Interest Rate of SBA Loans Made in 2018: 7.0%
- Average Loan Term for SBA Loans Made in 2018: 6 Years
- Average Default Rate of SBA Loans from 2010 to 2018: 18.9%
Coast360 Federal Credit Union, is a credit union established to serve the residents of Guam. Coast360 FCU originated seven loans totaling $335,300 in Guam in fiscal year 2018. This presented 38.9% of the total number of SBA loans made in Guam.
Guam Small Business Industry Statistics
The three NAICS codes for small businesses employing the largest number of people in Guam, and the number of SBA loans made in those industries are:
| Ranking |
|
|
|
|
|---|---|---|---|---|
| 1 |
|
|
|
|
| 2 |
|
|
|
|
| 3 |
|
|
|
|
Guam Small Business Employment Statistics
The number of people employed by small businesses in Guam, and the number of jobs supported by SBA loans are:
- Number of People in Guam Employed by Small Businesses: 51,717
- Number of Jobs Supported by SBA Loans from 2010 to 2018: 5,046
- Percent of Jobs Supported by SBA Loans from 2010 to 2018: 9.8%
- Number of Jobs Supported by SBA Loans in 2018: 77
- Percent of Jobs Supported by SBA Loans in 2018: 0.1%
SBA loan funds helped support roughly 10% of the jobs created by small businesses in Guam from 2010 to 2018.
Number of People in Guam Employed by Small Businesses
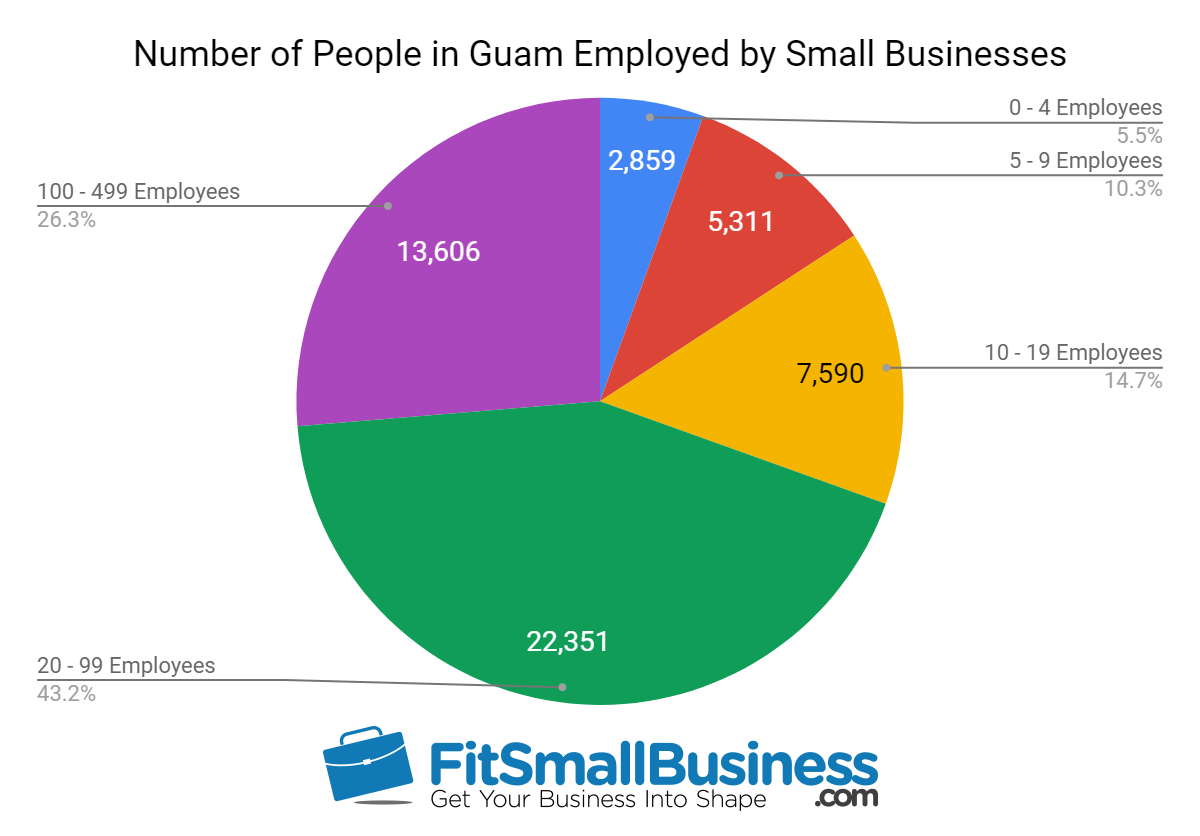
Source: SUSB Data
Guam SBA Franchise Loan Statistics
The SBA loan statistics for franchise financing in Guam from 2010 to 2018 are:
Of the five SBA franchise loans made in Guam between 2010 and 2018, two loans went to borrowers financing a Mathnasium Learning Center franchise.
13. Hawaii SBA Statistics and Small Business Industry Statistics
As of 2016, small businesses employed 275,115 people in the state of Hawaii. Over $30 million in SBA loan funds went to small businesses in Hawaii in 2018 alone. The leading industry supported with SBA loan funds between 2010 and 2018 was the construction industry, which received 491 loans, and is one of the top three small business industries in the state. The top franchise financed by SBA loans in Hawaii was Subway Sandwich.
The SBA loan statistics and other small business industry statistics we evaluated for Hawaii are:
Hawaii SBA Loan Statistics
The primary SBA loan statistics for the state of Hawaii are:
- Top SBA Lender: Central Pacific Bank
- Number of SBA Loans Approved in 2018: 208
- Total Dollar Amount of SBA Loans Approved in 2018: $30,389,240
- Average Interest Rate of SBA Loans Made in 2018: 8.8%
- Average Loan Term for SBA Loans Made in 2018: 7 Years
- Average Default Rate of SBA Loans from 2010 to 2018: 13.8%
Central Pacific Bank is a Hawaii-based financial institution. Central Pacific Bank originated 102 loans totaling $2,653,225 in the state of Hawaii in fiscal year 2018. This represented 49% of the total number of SBA loans made in the state.
Hawaii Small Business Industry Statistics
The three NAICS codes for small businesses employing the largest number of people in Hawaii, and the number of SBA loans made in those industries are:
| Ranking |
|
|
|
|
|---|---|---|---|---|
| 1 |
|
|
|
|
| 2 |
|
|
|
|
| 3 |
|
|
|
|
Hawaii Small Business Employment Statistics
The number of people employed by small businesses in Hawaii, and the number of jobs supported by SBA loans are:
- Number of People in Hawaii Employed by Small Businesses: 275,115
- Number of Jobs Supported by SBA Loans from 2010 to 2018: 22,274
- Percent of Jobs Supported by SBA Loans from 2010 to 2018: 8.1%
- Number of Jobs Supported by SBA Loans in 2018: 1,866
- Percent of Jobs Supported by SBA Loans in 2018: 0.7%
SBA loan funds helped support roughly 8% of the jobs created by small businesses in the state of Hawaii from 2010 to 2018.
Number of People in Hawaii Employed by Small Businesses
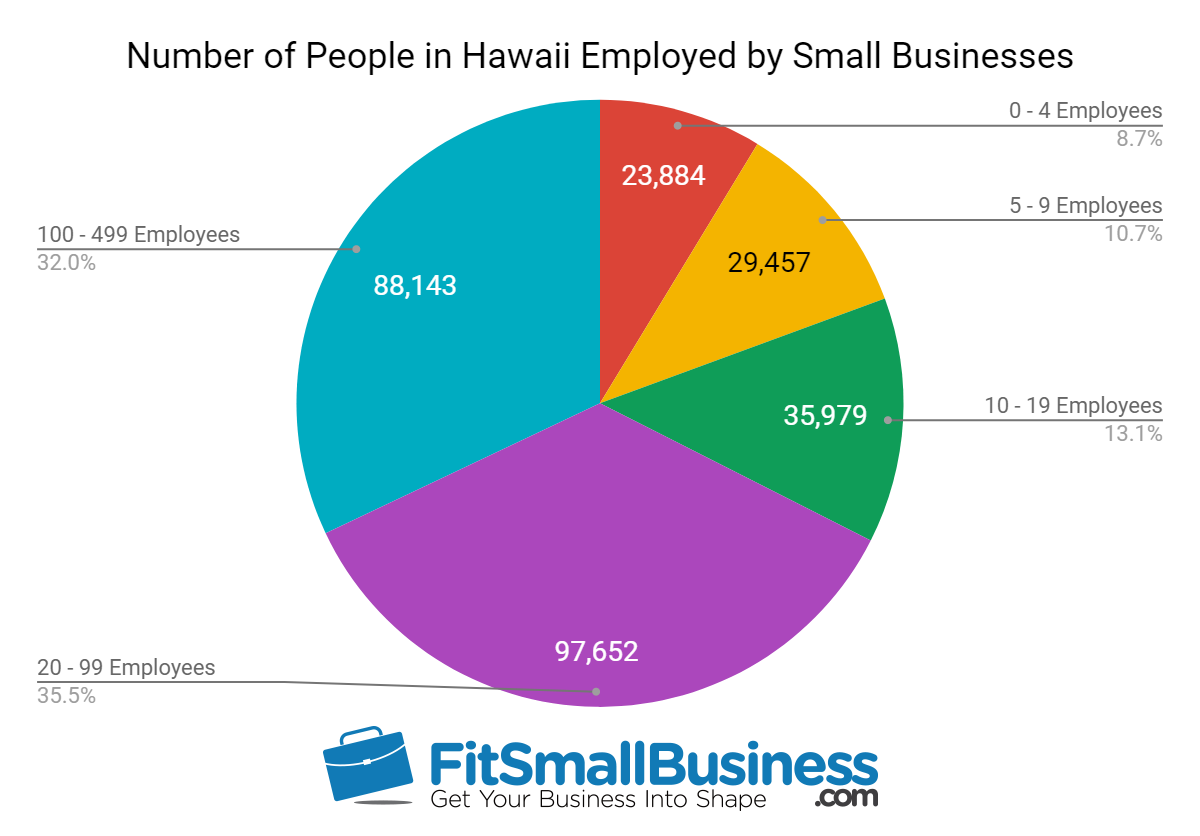
Source: SBA & SUSB Data
Hawaii SBA Franchise Loan Statistics
The SBA loan statistics for franchise financing in Hawaii from 2010 to 2018 are:
- Number of SBA Franchise Loans Made from 2010 to 2018: 50
- Top Franchise Funded by SBA Loans in Hawaii: Subway Sandwich
Of the 50 SBA franchise loans made in Hawaii between 2010 and 2018, eight loans went to borrowers financing a Subway Sandwich franchise. Subway was in the list of the top 50 franchises as determined by SBA loan default rates from 2010 to 2018.
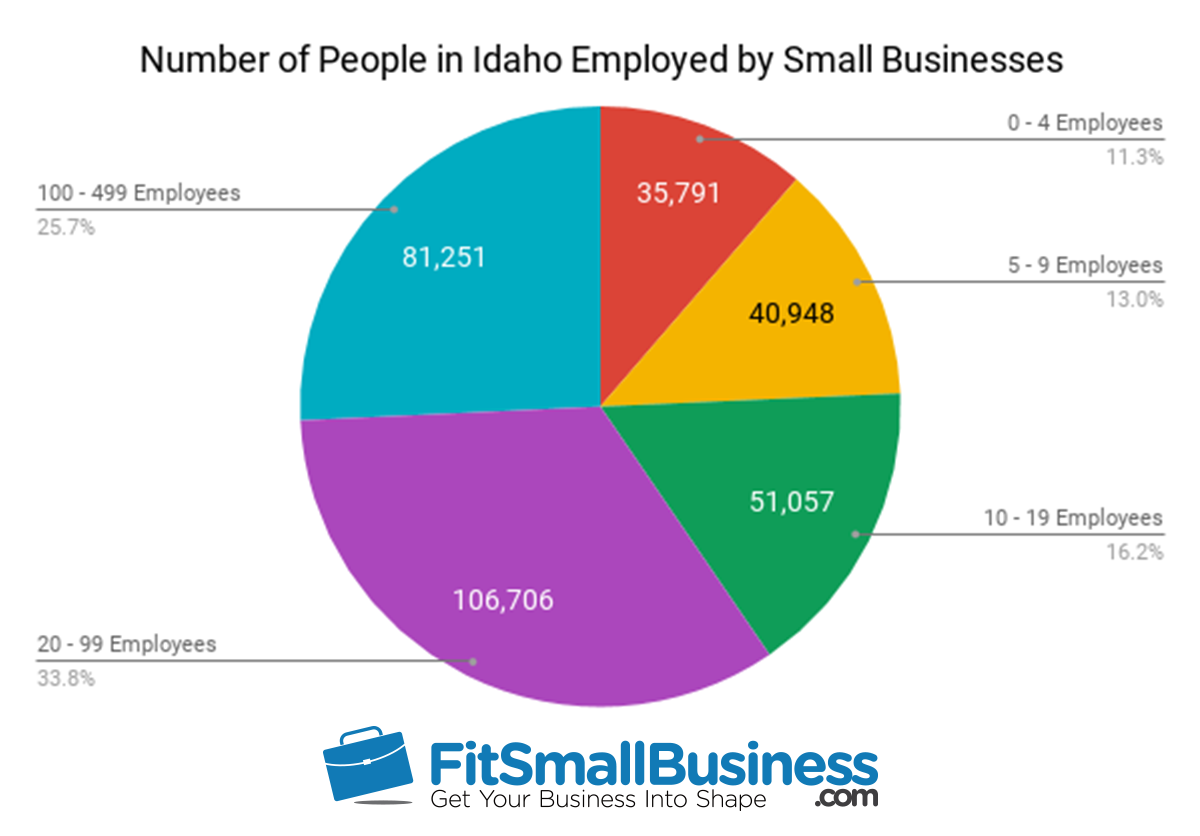
14. Idaho SBA Statistics and Small Business Industry Statistics
As of 2016, small businesses employed 315,753 people in the state of Idaho. Over $118 million in SBA loan funds went to small businesses in Idaho in 2018 alone. The leading industry supported with SBA loan funds between 2010 and 2018 was the construction industry, which received 669 loans, and is one of the top three small business industries in the state. The top franchise financed by SBA loans in Idaho was Dutch Brothers Coffee.
The SBA loan statistics and other small business industry statistics we evaluated for Idaho are:
Idaho SBA Loan Statistics
The primary SBA loan statistics for the state of Idaho are:
- Top SBA Lender: Zions Bank
- Number of SBA Loans Approved in 2018: 519
- Total Dollar Amount of SBA Loans Approved in 2018: $118,039,775
- Average Interest Rate of SBA Loans Made in 2018: 8.4%
- Average Loan Term for SBA Loans Made in 2018: 13 Years
- Average Default Rate of SBA Loans from 2010 to 2018: 12.7%
Zions Bank has a large presence in the western United States, including Idaho, and is one of the top 100 SBA lenders nationally. In 2018, Zions Bank originated 88 loans totaling $9,646,040 in the state of Idaho. This represented 16.9% of the total number of SBA loans made in the state.
Idaho Small Business Industry Statistics
The three NAICS codes for small businesses employing the largest number of people in Idaho, and the number of SBA loans made in those industries are:
| Ranking |
|
|
|
|
|---|---|---|---|---|
| 1 |
|
|
|
|
| 2 |
|
|
|
|
| 3 |
|
|
|
|
Idaho Small Business Employment Statistics
The number of people employed by small businesses in Idaho, and the number of jobs supported by SBA loans are:
- Number of People in Idaho Employed by Small Businesses: 315,753
- Number of Jobs Supported by SBA Loans from 2010 to 2018: 41,622
- Percent of Jobs Supported by SBA Loans from 2010 to 2018: 13.2%
- Number of Jobs Supported by SBA Loans in 2018: 4,000
- Percent of Jobs Supported by SBA Loans in 2018: 1.3%
SBA loan funds helped support roughly 13% of the jobs created by small businesses in the state of Idaho from 2010 to 2018.
Number of People in Idaho Employed by Small Businesses
Source: SBA & SUSB Data
Idaho SBA Franchise Loan Statistics
The SBA loan statistics for franchise financing in Idaho from 2010 to 2018 are:
- Number of SBA Franchise Loans Made from 2010 to 2018: 236
- Top Franchise Funded by SBA Loans in Idaho: Dutch Brothers Coffee
Of the 236 SBA franchise loans made in Idaho between 2010 and 2018, 12 loans went to borrowers financing a Dutch Brothers Coffee franchise.
15. Illinois SBA Statistics and Small Business Industry Statistics
As of 2016, small businesses employed 2,485,857 people in the state of Illinois. Over $673 million in SBA loan funds went to small businesses in Illinois in 2018 alone. The leading industry supported with SBA loan funds between 2010 and 2018 was the accommodation and food service industry, which received 2,035 loans, and is one of the top three small business industries in the state. The top franchise financed by SBA loans in Illinois was Subway Sandwich.
The SBA loan statistics and other small business industry statistics we evaluated for Illinois are:
Illinois SBA Loan Statistics
The primary SBA loan statistics for the state of Illinois are:
- Top SBA Lender: The Huntington National Bank
- Number of SBA Loans Approved in 2018: 2,034
- Total Dollar Amount of SBA Loans Approved in 2018: $673,334,103
- Average Interest Rate of SBA Loans Made in 2018: 8.0%
- Average Loan Term for SBA Loans Made in 2018: 12 Years
- Average Default Rate of SBA Loans from 2010 to 2018: 16.0%
The Huntington National Bank was the top SBA lender in Illinois for 2018, and is also one of the top SBA lenders nationally. The Huntington National Bank originated 267 loans totaling $52,296,170 in the state of Illinois in fiscal year 2018. This represented 13.1% of the total number of SBA loans made in the state.
Illinois Small Business Industry Statistics
The three NAICS codes for small businesses employing the largest number of people in Illinois, and the number of SBA loans made in those industries are:
| Ranking |
|
|
|
|
|---|---|---|---|---|
| 1 |
|
|
|
|
| 2 |
|
|
|
|
| 3 |
|
|
|
|
Illinois Small Business Employment Statistics
The number of people employed by small businesses in Illinois, and the number of jobs supported by SBA loans are:
- Number of People in Illinois Employed by Small Businesses: 2,485,857
- Number of Jobs Supported by SBA Loans from 2010 to 2018: 186,981
- Percent of Jobs Supported by SBA Loans from 2010 to 2018: 7.5%
- Number of Jobs Supported by SBA Loans in 2018: 22,899
- Percent of Jobs Supported by SBA Loans in 2018: 0.9%
SBA loan funds helped support more than 7% of the jobs created by small businesses in the state of Illinois from 2010 to 2018.
Number of People in Illinois Employed by Small Businesses
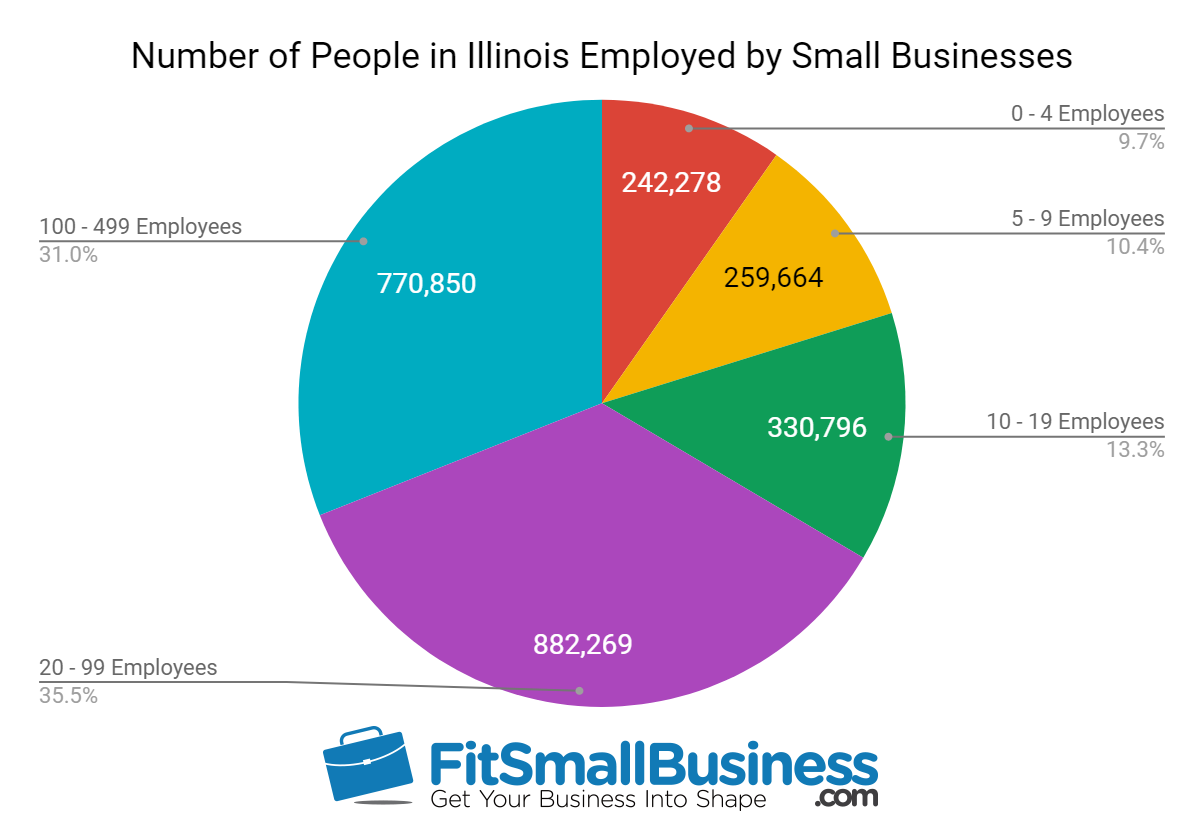
Source: SBA & SUSB Data
Illinois SBA Franchise Loan Statistics
The SBA loan statistics for franchise financing in Illinois from 2010 to 2018 are:
- Number of SBA Franchise Loans Made from 2010 to 2018: 1,288
- Top Franchise Funded by SBA Loans in Illinois: Subway Sandwich
Of the 1,288 SBA franchise loans made in Illinois between 2010 and 2018, 84 loans went to borrowers financing a Subway Sandwich franchise. Subway was in the list of the top 50 franchises as determined by SBA loan default rates from 2010 to 2018.
16. Indiana SBA Statistics and Small Business Industry Statistics
As of 2016, small businesses employed 1,222,372 people in the state of Indiana. Over $368 million in SBA loan funds went to small businesses in Indiana in 2018 alone. The leading industry supported with SBA loan funds between 2010 and 2018 was the accommodation and food service industry, which received 1,466 loans, and is one of the top three small business industries in the state. The top franchise financed by SBA loans in Indiana was Subway Sandwich.
The SBA loan statistics and other small business industry statistics we evaluated for Indiana are:
Indiana SBA Loan Statistics
The primary SBA loan statistics for the state of Indiana are:
- Top SBA Lender: The Huntington National Bank
- Number of SBA Loans Approved in 2018: 1,358
- Total Dollar Amount of SBA Loans Approved in 2018: $368,140,810
- Average Interest Rate of SBA Loans Made in 2018: 8.3%
- Average Loan Term for SBA Loans Made in 2018: 12 Years
- Average Default Rate of SBA Loans from 2010 to 2018: 13.5%
The Huntington National Bank is one of the top 100 SBA lenders, operating in the Midwest. The Huntington National Bank originated 352 loans totaling $33,327,025 in the state of Indiana in fiscal year 2018. This represented 25.9% of the total number of SBA loans made in the state.
Indiana Small Business Industry Statistics
The three NAICS codes for small businesses employing the largest number of people in Indiana, and the number of SBA loans made in those industries are:
| Ranking |
|
|
|
|
|---|---|---|---|---|
| 1 |
|
|
|
|
| 2 |
|
|
|
|
| 3 |
|
|
|
|
Indiana Small Business Employment Statistics
The number of people employed by small businesses in Indiana, and the number of jobs supported by SBA loans are:
- Number of People in Indiana Employed by Small Businesses: 1,222,372
- Number of Jobs Supported by SBA Loans from 2010 to 2018: 119,041
- Percent of Jobs Supported by SBA Loans from 2010 to 2018: 9.7%
- Number of Jobs Supported by SBA Loans in 2018: 12,283
- Percent of Jobs Supported by SBA Loans in 2018: 1.0%
SBA loan funds helped support nearly 10% of the jobs created by small businesses in the state of Indiana from 2010 to 2018.
Number of People in Indiana Employed by Small Businesses
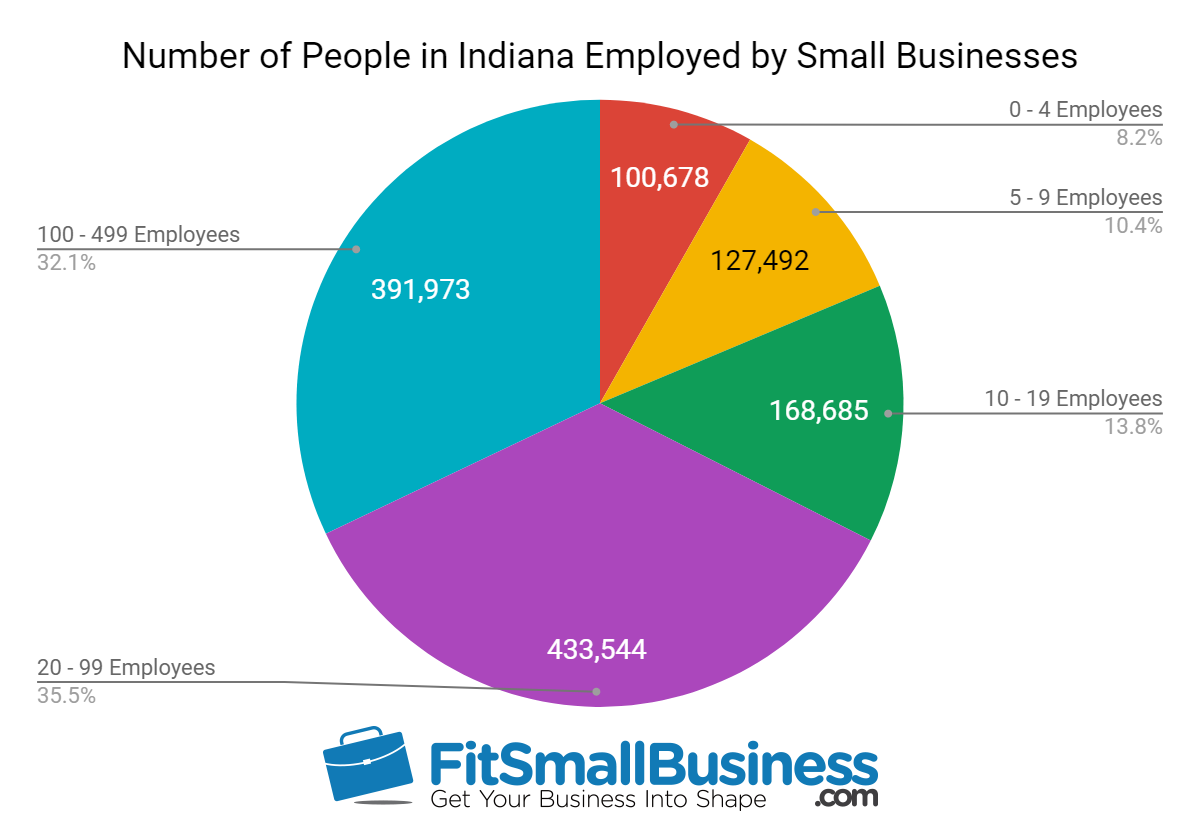
Source: SBA & SUSB Data
Indiana SBA Franchise Loan Statistics
he SBA loan statistics for franchise financing in Indiana from 2010 to 2018 are:
- Number of SBA Franchise Loans Made from 2010 to 2018: 919
- Top Franchise Funded by SBA Loans in Indiana: Subway Sandwich
Of the 919 SBA franchise loans made in Indiana between 2010 and 2018, 52 loans went to borrowers financing a Subway Sandwich franchise. Subway was in the list of the top 50 franchises as determined by SBA loan default rates from 2010 to 2018.
17. Iowa SBA Statistics and Small Business Industry Statistics
As of 2016, small businesses employed 651,635 people in the state of Iowa. Nearly $101 million in SBA loan funds went to small businesses in Iowa in 2018 alone. The leading industry supported with SBA loan funds between 2010 and 2018 was the accommodation and food service industry, which received 532 loans, and is one of the top three small business industries in the state. The top franchise financed by SBA loans in Iowa was Subway Sandwich.
The SBA loan statistics and other small business industry statistics we evaluated for Iowa are:
Iowa SBA Loan Statistics
The primary SBA loan statistics for the state of Iowa are:
- Top SBA Lender: Wells Fargo
- Number of SBA Loans Approved in 2018: 349
- Total Dollar Amount of SBA Loans Approved in 2018: $100,949,651
- Average Interest Rate of SBA Loans Made in 2018: 10.9%
- Average Loan Term for SBA Loans Made in 2018: 11 Years
- Average Default Rate of SBA Loans from 2010 to 2018: 14.1%
For the state of Iowa in 2018, Wells Fargo was the top SBA lender. This doesn’t come as a surprise, since Wells Fargo is also the top lender nationally in 2018. Wells Fargo originated 24 loans totaling $4,291,425 in the state of Iowa in fiscal year 2018. This represented 6.9% of the total number of SBA loans made in the state.
Iowa Small Business Industry Statistics
The three NAICS codes for small businesses employing the largest number of people in Iowa, and the number of SBA loans made in those industries are:
| Ranking |
|
|
|
|
|---|---|---|---|---|
| 1 |
|
|
|
|
| 2 |
|
|
|
|
| 3 |
|
|
|
|
Iowa Small Business Employment Statistics
The number of people employed by small businesses in Iowa, and the number of jobs supported by SBA loans are:
- Number of People in Iowa Employed by Small Businesses: 651,635
- Number of Jobs Supported by SBA Loans from 2010 to 2018: 52,029
- Percent of Jobs Supported by SBA Loans from 2010 to 2018: 7.9%
- Number of Jobs Supported by SBA Loans in 2018: 3,396
- Percent of Jobs Supported by SBA Loans in 2018: 0.5%
SBA loan funds helped support roughly 8% of the jobs created by small businesses in the state of Iowa from 2010 to 2018.
Number of People in Iowa Employed by Small Businesses

Source: SBA & SUSB Data
Iowa SBA Franchise Loan Statistics
The SBA loan statistics for franchise financing in Iowa from 2010 to 2018 are:
- Number of SBA Franchise Loans Made from 2010 to 2018: 365
- Top Franchise Funded by SBA Loans in Iowa: Subway Sandwich
Of the 365 SBA franchise loans made in Iowa between 2010 and 2018, 24 loans went to borrowers financing a Subway Sandwich franchise. Subway was in the list of the top 50 franchises as determined by SBA loan default rates from 2010 to 2018.
18. Kansas SBA Statistics and Small Business Industry Statistics
As of 2016, small businesses employed 580,495 people in the state of Kansas. Over $121 million in SBA loan funds went to small businesses in Kansas in 2018 alone. The leading industry supported with SBA loan funds between 2010 and 2018 was the accommodation and food service industry, which received 429 loans, and is one of the top three small business industries in the state. The top franchise financed by SBA loans in Kansas was Sonic.
The SBA loan statistics and other small business industry statistics we evaluated for Kansas are:
Kansas SBA Loan Statistics
The primary SBA loan statistics for the state of Kansas are:
- Top SBA Lender: U.S. Bank
- Number of SBA Loans Approved in 2018: 381
- Total Dollar Amount of SBA Loans Approved in 2018: $121,593,255
- Average Interest Rate of SBA Loans Made in 2018: 7.3%
- Average Loan Term for SBA Loans Made in 2018: 11 Years
- Average Default Rate of SBA Loans from 2010 to 2018: 13.7%
In 2018, U.S. Bank was the top SBA lender in Kansas, as well as being one of the top lenders nationally. U.S. Bank originated 25 loans totaling $1,028,500 in the state of Kansas in fiscal year 2018. This represented 6.6% of the total number of SBA loans made in the state.
Kansas Small Business Industry Statistics
The three NAICS codes for small businesses employing the largest number of people in Kansas, and the number of SBA loans made in those industries are:
| Ranking |
|
|
|
|
|---|---|---|---|---|
| 1 |
|
|
|
|
| 2 |
|
|
|
|
| 3 |
|
|
|
|
Kansas Small Business Employment Statistics
The number of people employed by small businesses in Kansas, and the number of jobs supported by SBA loans are:
- Number of People in Kansas Employed by Small Businesses: 580,495
- Number of Jobs Supported by SBA Loans from 2010 to 2018: 49,192
- Percent of Jobs Supported by SBA Loans from 2010 to 2018: 8.5%
- Number of Jobs Supported by SBA Loans in 2018: 3,878
- Percent of Jobs Supported by SBA Loans in 2018: 0.7 %
SBA loan funds helped support more than 8% of the jobs created by small businesses in the state of Kansas from 2010 to 2018.
Number of People in Kansas Employed by Small Businesses

Source: SBA & SUSB Data
Kansas SBA Franchise Loan Statistics
The SBA loan statistics for franchise financing in Kansas from 2010 to 2018 are:
- Number of SBA Franchise Loans Made from 2010 to 2018: 369
- Top Franchise Funded by SBA Loans in Kansas: Sonic
Of the 369 SBA franchise loans made in Kansas between 2010 and 2018, nine loans went to borrowers financing a Sonic franchise.
19. Kentucky SBA Statistics and Small Business Industry Statistics
As of 2016, small businesses employed 702,054 people in the state of Kentucky. Nearly $114 million in SBA loan funds went to small businesses in Kentucky in 2018 alone. The leading industry supported with SBA loan funds between 2010 and 2018 was the accommodation and food service industry, which received 655 loans, and is one of the top three small business industries in the state. The top franchise financed by SBA loans in Kentucky was Subway Sandwich.
The SBA loan statistics and other small business industry statistics we evaluated for Kentucky are:
Kentucky SBA Loan Statistics
The primary SBA loan statistics for the state of Kentucky are:
- Top SBA Lender: The Huntington National Bank
- Number of SBA Loans Approved in 2018: 483
- Total Dollar Amount of SBA Loans Approved in 2018: $113,905,163
- Average Interest Rate of SBA Loans Made in 2018: 7.9%
- Average Loan Term for SBA Loans Made in 2018: 11 Years
- Average Default Rate of SBA Loans from 2010 to 2018: 14.9%
In 2018, The Huntington National Bank was the top SBA lender in Kentucky, as well as being one of the top 100 SBA lenders nationally. The Huntington National Bank originated 99 loans totaling $16,415,600 in the state of Kentucky in fiscal year 2018. This represented 20.5% of the total number of SBA loans made in the state.
Kentucky Small Business Industry Statistics
The three NAICS codes for small businesses employing the largest number of people in Kentucky, and the number of SBA loans made in those industries are:
| Ranking |
|
|
|
|
|---|---|---|---|---|
| 1 |
|
|
|
|
| 2 |
|
|
|
|
| 3 |
|
|
|
|
Kentucky Small Business Employment Statistics
The number of people employed by small businesses in Kentucky, and the number of jobs supported by SBA loans are:
- Number of People in Kentucky Employed by Small Businesses: 702,054
- Number of Jobs Supported by SBA Loans from 2010 to 2018: 48,806
- Percent of Jobs Supported by SBA Loans from 2010 to 2018: 6.7%
- Number of Jobs Supported by SBA Loans in 2018: 4,372
- Percent of Jobs Supported by SBA Loans in 2018: 0.6%
SBA loan funds helped support nearly 7% of the jobs created by small businesses in the state of Kentucky from 2010 to 2018.
Number of People in Kentucky Employed by Small Businesses

Source: SBA & SUSB Data
Kentucky SBA Franchise Loan Statistics
The SBA loan statistics for franchise financing in Kentucky from 2010 to 2018 are:
- Number of SBA Franchise Loans Made from 2010 to 2018: 495
- Top Franchise Funded by SBA Loans in Kentucky: Subway Sandwich
Of the 495 SBA franchise loans made in Kentucky between 2010 and 2018, 30 loans went to borrowers financing a Subway Sandwich franchise. Subway was in the list of the top 50 franchises as determined by SBA loan default rates from 2010 to 2018.
20. Louisiana SBA Statistics and Small Business Industry Statistics
As of 2016, small businesses employed 902,758 people in the state of Louisiana. Over $234 million in SBA loan funds went to small businesses in Louisiana in 2018 alone. The leading industry supported with SBA loan funds between 2010 and 2018 was the accommodation and food service industry, which received 558 loans, and is one of the top three small business industries in the state. The top franchise financed by SBA loans in Louisiana was Anytime Fitness.
The SBA loan statistics and other small business industry statistics we evaluated for Louisiana are:
Louisiana SBA Loan Statistics
The primary SBA loan statistics for the state of Louisiana are:
- Top SBA Lender: Chase Bank
- Number of SBA Loans Approved in 2018: 472
- Total Dollar Amount of SBA Loans Approved in 2018: $234,017,674
- Average Interest Rate of SBA Loans Made in 2018: 7.7%
- Average Loan Term for SBA Loans Made in 2018: 13 Years
- Average Default Rate of SBA Loans from 2010 to 2018: 15.2%
Chase Bank is one of the top 100 SBA lenders, with national operations. Chase Bank originated 54 loans totaling $8,380,525 in the state of Louisiana in fiscal year 2018. This represented 11.4% of the total number of SBA loans made in the state.
Louisiana Small Business Industry Statistics
The three NAICS codes for small businesses employing the largest number of people in Louisiana, and the number of SBA loans made in those industries are:
| Ranking |
|
|
|
|
|---|---|---|---|---|
| 1 |
|
|
|
|
| 2 |
|
|
|
|
| 3 |
|
|
|
|
Louisiana Small Business Employment Statistics
The number of people employed by small businesses in Louisiana, and the number of jobs supported by SBA loans are:
- Number of People in Louisiana Employed by Small Businesses: 902,758
- Number of Jobs Supported by SBA Loans from 2010 to 2018: 48,398
- Percent of Jobs Supported by SBA Loans from 2010 to 2018: 5.4%
- Number of Jobs Supported by SBA Loans in 2018: 6,032
- Percent of Jobs Supported by SBA Loans in 2018: 0.7%
SBA loan funds helped support roughly 5% of the jobs created by small businesses in the state of Louisiana from 2010 to 2018.
Number of People in Louisiana Employed by Small Businesses
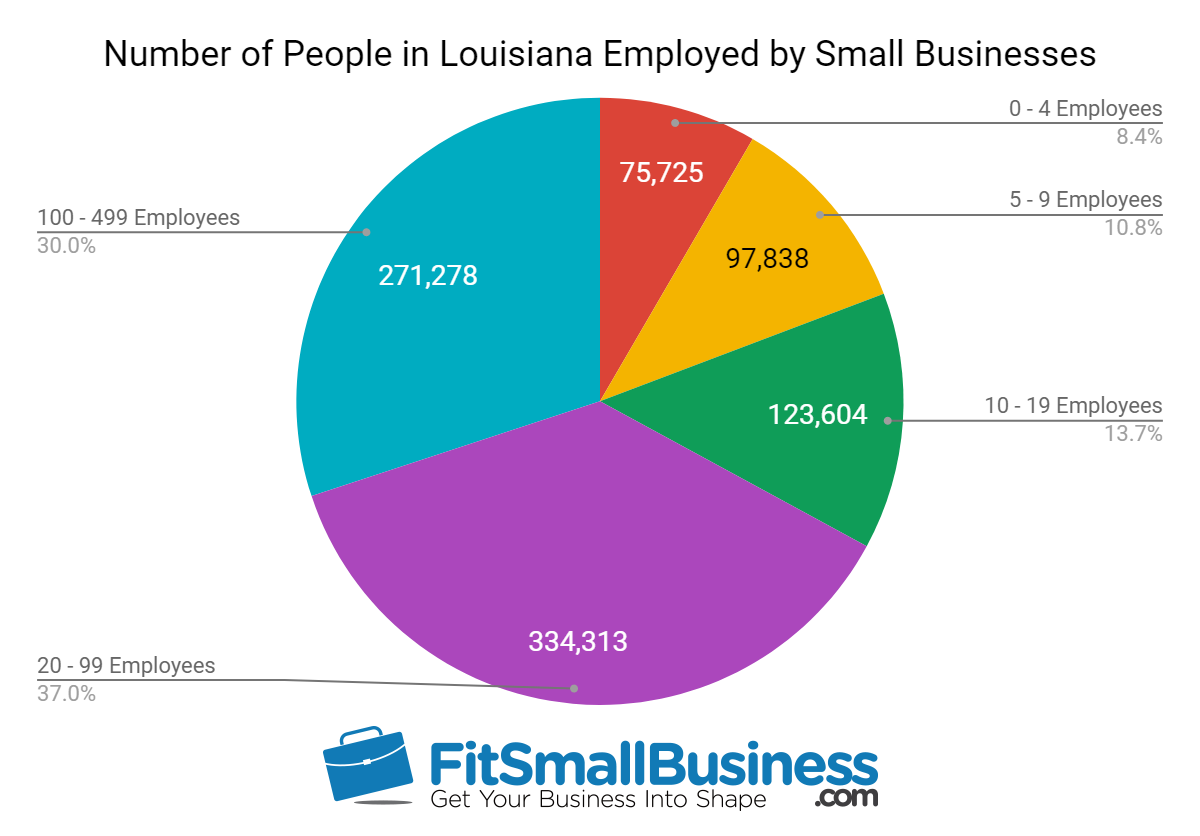
Source: SBA & SUSB Data
Louisiana SBA Franchise Loan Statistics
The SBA loan statistics for franchise financing in Louisiana from 2010 to 2018 are:
- Number of SBA Franchise Loans Made from 2010 to 2018: 336
- Top Franchise Funded by SBA Loans in Louisiana: Anytime Fitness
Of the 336 SBA franchise loans made in Louisiana between 2010 and 2018, 21 loans went to borrowers financing an Anytime Fitness franchise.
21. Maine SBA Statistics and Small Business Industry Statistics
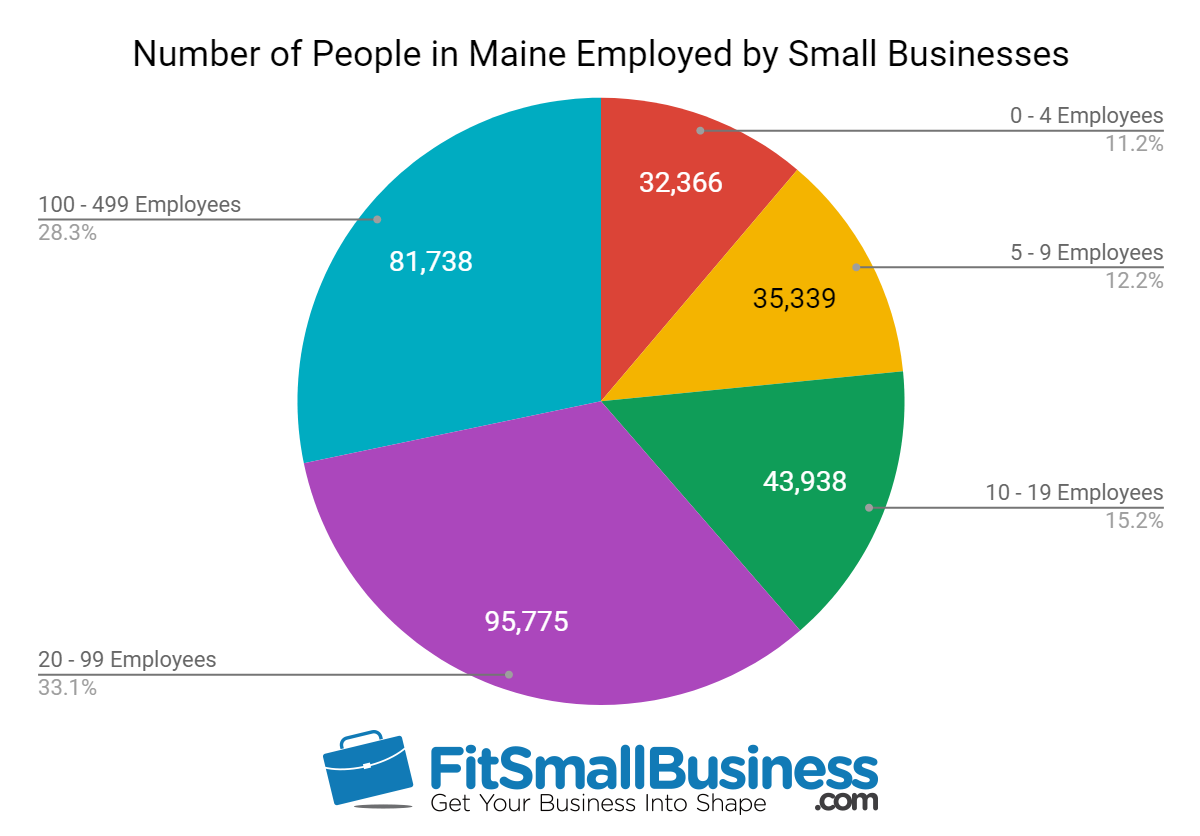
As of 2016, small businesses employed 289,156 people in the state of Maine. Nearly $35 million in SBA loan funds went to small businesses in Maine in 2018 alone. The leading industry supported with SBA loan funds between 2010 and 2018 was the accommodation and food service industry, which received 432 loans, and is one of the top three small business industries in the state. The top franchise financed by SBA loans in Maine was Planet Fitness.
The SBA loan statistics and other small business industry statistics we evaluated for Maine are:
Maine SBA Loan Statistics
The primary SBA loan statistics for the state of Maine are:
- Top SBA Lender: TD Bank
- Number of SBA Loans Approved in 2018: 289
- Total Dollar Amount of SBA Loans Approved in 2018: $34,945,745
- Average Interest Rate of SBA Loans Made in 2018: 8.2%
- Average Loan Term for SBA Loans Made in 2018: 10 Years
- Average Default Rate of SBA Loans from 2010 to 2018: 12.2%
In 2018, TD Bank (a regional bank serving the East Coast) was the top SBA lender in Maine. Additionally, TD Bank is one of the top 100 SBA lenders nationwide. TD Bank originated 88 loans totaling $3,283,900 in the state of Maine in fiscal year 2018. This represented 30.4% of the total number of SBA loans made in the state.
Maine Small Business Industry Statistics
The three NAICS codes for small businesses employing the largest number of people in Maine, and the number of SBA loans made in those industries are:
| Ranking |
|
|
|
|
|---|---|---|---|---|
| 1 |
|
|
|
|
| 2 |
|
|
|
|
| 3 |
|
|
|
|
Maine Small Business Employment Statistics
The number of people employed by small businesses in Maine, and the number of jobs supported by SBA loans are:
- Number of People in Maine Employed by Small Businesses: 289,156
- Number of Jobs Supported by SBA Loans from 2010 to 2018: 26,544
- Percent of Jobs Supported by SBA Loans from 2010 to 2018: 9.2%
- Number of Jobs Supported by SBA Loans in 2018: 1,716
- Percent of Jobs Supported by SBA Loans in 2018: 0.6%
SBA loan funds helped support roughly 9% of the jobs created by small businesses in the state of Maine from 2010 to 2018.
Number of People in Maine Employed by Small Businesses
Source: SBA & SUSB Data
Maine SBA Franchise Loan Statistics
The SBA loan statistics for franchise financing in Maine from 2010 to 2018 are:
- Number of SBA Franchise Loans Made from 2010 to 2018: 115
- Top Franchise Funded by SBA Loans in Maine: Planet Fitness
Of the 115 SBA franchise loans made in Maine between 2010 and 2018, nine loans went to borrowers financing a Planet Fitness franchise.
22. Maryland SBA Statistics and Small Business Industry Statistics
As of 2016, small businesses employed 1,143,191 people in the state of Maryland. Nearly $236 million in SBA loan funds went to small businesses in Maryland in 2018 alone. The leading industry supported with SBA loan funds between 2010 and 2018 was the professional, scientific, and technical services industry, which received 1,223 loans, and is one of the top three small business industries in the state. The top franchise financed by SBA loans in Maryland was Sport Clips.
The SBA loan statistics and other small business industry statistics we evaluated for Maryland are:
Maryland SBA Loan Statistics
The primary SBA loan statistics for the state of Maryland are:
- Top SBA Lender: Manufacturers and Traders Trust Company
- Number of SBA Loans Approved in 2018: 1,026
- Total Dollar Amount of SBA Loans Approved in 2018: $235,953,355
- Average Interest Rate of SBA Loans Made in 2018: 9.4%
- Average Loan Term for SBA Loans Made in 2018: 12 Years
- Average Default Rate of SBA Loans from 2010 to 2018: 13.8%
During 2018, Manufacturers and Traders Trust Company, one of the top 100 SBA lenders, originated the most loans in Maryland. In fiscal year 2018, Manufacturers and Traders Trust Company originated 420 loans totaling $33,181,340 in the state of Maryland. This represented 40.9% of the total number of SBA loans made in the state.
Maryland Small Business Industry Statistics
The three NAICS codes for small businesses employing the largest number of people in Maryland, and the number of SBA loans made in those industries are:
| Ranking |
|
|
|
|
|---|---|---|---|---|
| 1 |
|
|
|
|
| 2 |
|
|
|
|
| 3 |
|
|
|
|
Maryland Small Business Employment Statistics
The number of people employed by small businesses in Maryland, and the number of jobs supported by SBA loans are:
- Number of People in Maryland Employed by Small Businesses: 1,143,191
- Number of Jobs Supported by SBA Loans from 2010 to 2018: 83,668
- Percent of Jobs Supported by SBA Loans from 2010 to 2018: 7.3%
- Number of Jobs Supported by SBA Loans in 2018: 10,060
- Percent of Jobs Supported by SBA Loans in 2018: 0.9%
SBA loan funds helped support roughly 7% of the jobs created by small businesses in the state of Maryland from 2010 to 2018.
Number of People in Maryland Employed by Small Businesses

Source: SBA & SUSB Data
Maryland SBA Franchise Loan Statistics
The SBA loan statistics for franchise financing in Maryland from 2010 to 2018 are:
- Number of SBA Franchise Loans Made from 2010 to 2018: 555
- Top Franchise Funded by SBA Loans in Maryland: Sport Clips
Of the 555 SBA franchise loans made in Maryland between 2010 and 2018, 23 loans went to borrowers financing a Sport Clips franchise.
23. Massachusetts SBA Statistics and Small Business Industry Statistics
As of 2016, small businesses employed 1,490,416 people in the state of Massachusetts. Nearly $241 million in SBA loan funds went to small businesses in Massachusetts in 2018 alone. The leading industry supported with SBA loan funds between 2010 and 2018 was the professional, scientific, and technical services industry, which received 2,527 loans, and is one of the top three small business industries in the state. The top franchise financed by SBA loans in Massachusetts was Subway Sandwich.
The SBA loan statistics and other small business industry statistics we evaluated for Massachusetts are:
Massachusetts SBA Loan Statistics
The primary SBA loan statistics for the state of Massachusetts are:
- Top SBA Lender: Eastern Bank
- Number of SBA Loans Approved in 2018: 2,126
- Total Dollar Amount of SBA Loans Approved in 2018: $240,502,545
- Average Interest Rate of SBA Loans Made in 2018: 8.9%
- Average Loan Term for SBA Loans Made in 2018: 9 Years
- Average Default Rate of SBA Loans from 2010 to 2018: 11.9%
Eastern Bank, a New England regional bank, is one of the top 100 SBA lenders. Eastern Bank originated 565 loans totaling $24,232,575 in the state of Massachusetts in fiscal year 2018. This represented 26.6% of the total number of SBA loans made in the state.
Massachusetts Small Business Industry Statistics
The three NAICS codes for small businesses employing the largest number of people in Massachusetts, and the number of SBA loans made in those industries are:
| Ranking |
|
|
|
|
|---|---|---|---|---|
| 1 |
|
|
|
|
| 2 |
|
|
|
|
| 3 |
|
|
|
|
Massachusetts Small Business Employment Statistics
The number of people employed by small businesses in Massachusetts, and the number of jobs supported by SBA loans are:
- Number of People in Massachusetts Employed by Small Businesses: 1,490,416
- Number of Jobs Supported by SBA Loans from 2010 to 2018: 144,875
- Percent of Jobs Supported by SBA Loans from 2010 to 2018: 9.7%
- Number of Jobs Supported by SBA Loans in 2018: 15,562
- Percent of Jobs Supported by SBA Loans in 2018: 1%
SBA loan funds helped support roughly 10% of the jobs created by small businesses in the state of Massachusetts from 2010 to 2018.
Number of People in Massachusetts Employed by Small Businesses

Source: SBA & SUSB Data
Massachusetts SBA Franchise Loan Statistics
The SBA loan statistics for franchise financing in Massachusetts from 2010 to 2018 are:
- Number of SBA Franchise Loans Made from 2010 to 2018: 579
- Top Franchise Funded by SBA Loans in Massachusetts: Subway Sandwich
Of the 579 SBA franchise loans made in Massachusetts between 2010 and 2018, 51 loans went to borrowers financing a Subway Sandwich franchise. Subway was in the list of the top 50 franchises as determined by SBA loan default rates from 2010 to 2018.
24. Michigan SBA Statistics and Small Business Industry Statistics
As of 2016, small businesses employed 1,868,885 people in the state of Michigan. Nearly $501 million in SBA loan funds went to small businesses in Michigan in 2018 alone. The leading industry supported with SBA loan funds between 2010 and 2018 was the transportation and warehousing industry, which received 2,861 loans. However, the transportation and warehousing industry is not one of the top three small business industries in the state. The top franchise financed by SBA loans in Michigan was Biggby Coffee.
The SBA loan statistics and other small business industry statistics we evaluated for Michigan are:
Michigan SBA Loan Statistics
The primary SBA loan statistics for the state of Michigan are:
- Top SBA Lender: The Huntington National Bank
- Number of SBA Loans Approved in 2018: 2,550
- Total Dollar Amount of SBA Loans Approved in 2018: $500,943,567
- Average Interest Rate of SBA Loans Made in 2018: 6.7%
- Average Loan Term for SBA Loans Made in 2018: 10 Years
- Average Default Rate of SBA Loans from 2010 to 2018: 12.3%
The top SBA lender in Michigan in 2018 was The Huntington National Bank. With operations in the Midwest, The Huntington National Bank is one of the top 100 SBA lenders. The Huntington National Bank originated 1,425 loans totaling $129,253,586 in the state of Michigan in fiscal year 2018. This represented 55.9% of the total number of SBA loans made in the state.
Michigan Small Business Industry Statistics
The three NAICS codes for small businesses employing the largest number of people in Michigan, and the number of SBA loans made in those industries are:
| Ranking |
|
|
|
|
|---|---|---|---|---|
| 1 |
|
|
|
|
| 2 |
|
|
|
|
| 3 |
|
|
|
|
| 11 |
|
|
|
|
Michigan Small Business Employment Statistics
The number of people employed by small businesses in Michigan, and the number of jobs supported by SBA loans are:
- Number of People in Michigan Employed by Small Businesses: 1,868,885
- Number of Jobs Supported by SBA Loans from 2010 to 2018: 192,679
- Percent of Jobs Supported by SBA Loans from 2010 to 2018: 10.3%
- Number of Jobs Supported by SBA Loans in 2018: 20,109
- Percent of Jobs Supported by SBA Loans in 2018: 1%
SBA loan funds helped support roughly 10% of the jobs created by small businesses in the state of Michigan from 2010 to 2018.
Number of People in Michigan Employed by Small Businesses
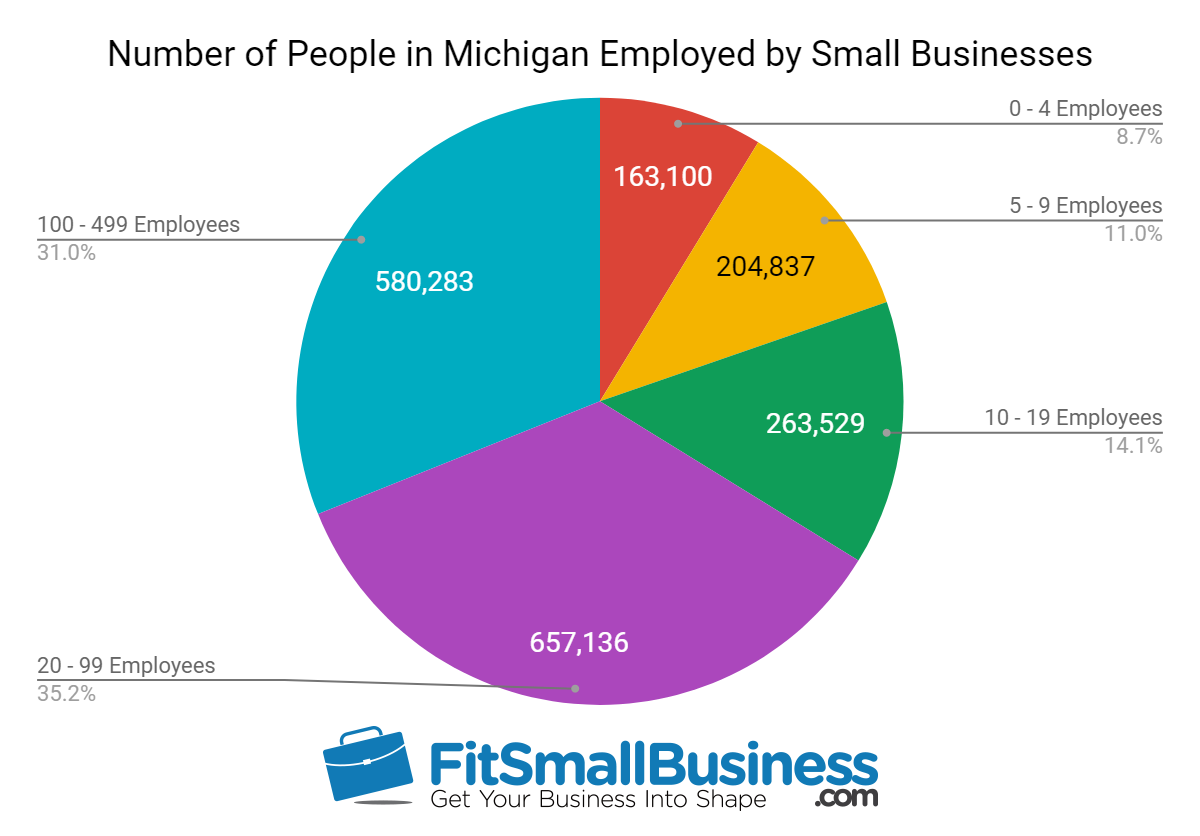
Source: SBA & SUSB Data
Michigan SBA Franchise Loan Statistics
The SBA loan statistics for franchise financing in Michigan from 2010 to 2018 are:
- Number of SBA Franchise Loans Made from 2010 to 2018: 1,175
- Top Franchise Funded by SBA Loans in Michigan: Biggby Coffee
Of the 1,175 SBA franchise loans made in Michigan between 2010 and 2018, 52 loans went to borrowers financing a Biggby Coffee franchise.
25. Minnesota SBA Statistics and Small Business Industry Statistics
As of 2016, small businesses employed 1,254,958 people in the state of Minnesota. Over $3.3 billion in SBA loan funds went to small businesses in Minnesota in 2018 alone. The leading industry supported with SBA loan funds between 2010 and 2018 was the construction industry, which received 1,708 loans. However, the construction industry is not one of the top three small business industries in the state. The top franchise financed by SBA loans in Minnesota was Anytime Fitness.
The SBA loan statistics and other small business industry statistics we evaluated for Minnesota are:
Minnesota SBA Loan Statistics
The primary SBA loan statistics for the state of Minnesota are:
- Top SBA Lender: Wells Fargo
- Number of SBA Loans Approved in 2018: 1,502
- Total Dollar Amount of SBA Loans Approved in 2018: $3,326,838,914
- Average Interest Rate of SBA Loans Made in 2018: 6.7%
- Average Loan Term for SBA Loans Made in 2018: 9 Years
- Average Default Rate of SBA Loans from 2010 to 2018: 12.2%
During the year 2018, Wells Fargo originated the most SBA loans in Minnesota. It’s also the top SBA lender nationally, and so this is not unexpected. Wells Fargo originated 130 loans totaling $35,354,605 in the state of Minnesota in fiscal year 2018. This represented 8.7% of the total number of SBA loans made in the state.
Minnesota Small Business Industry Statistics
The three NAICS codes for small businesses employing the largest number of people in Minnesota, and the number of SBA loans made in those industries are:
| Ranking |
|
|
|
|
|---|---|---|---|---|
| 1 |
|
|
|
|
| 2 |
|
|
|
|
| 3 |
|
|
|
|
| 7 |
|
|
|
|
Minnesota Small Business Employment Statistics
The number of people employed by small businesses in Minnesota, and the number of jobs supported by SBA loans are:
- Number of People in Minnesota Employed by Small Businesses: 1,254,958
- Number of Jobs Supported by SBA Loans from 2010 to 2018: 181,666
- Percent of Jobs Supported by SBA Loans from 2010 to 2018: 14.5%
- Number of Jobs Supported by SBA Loans in 2018: 15,964
- Percent of Jobs Supported by SBA Loans in 2018: 1.3%
SBA loan funds helped support more than 14% of the jobs created by small businesses in the state of Minnesota from 2010 to 2018.
Number of People in Minnesota Employed by Small Businesses
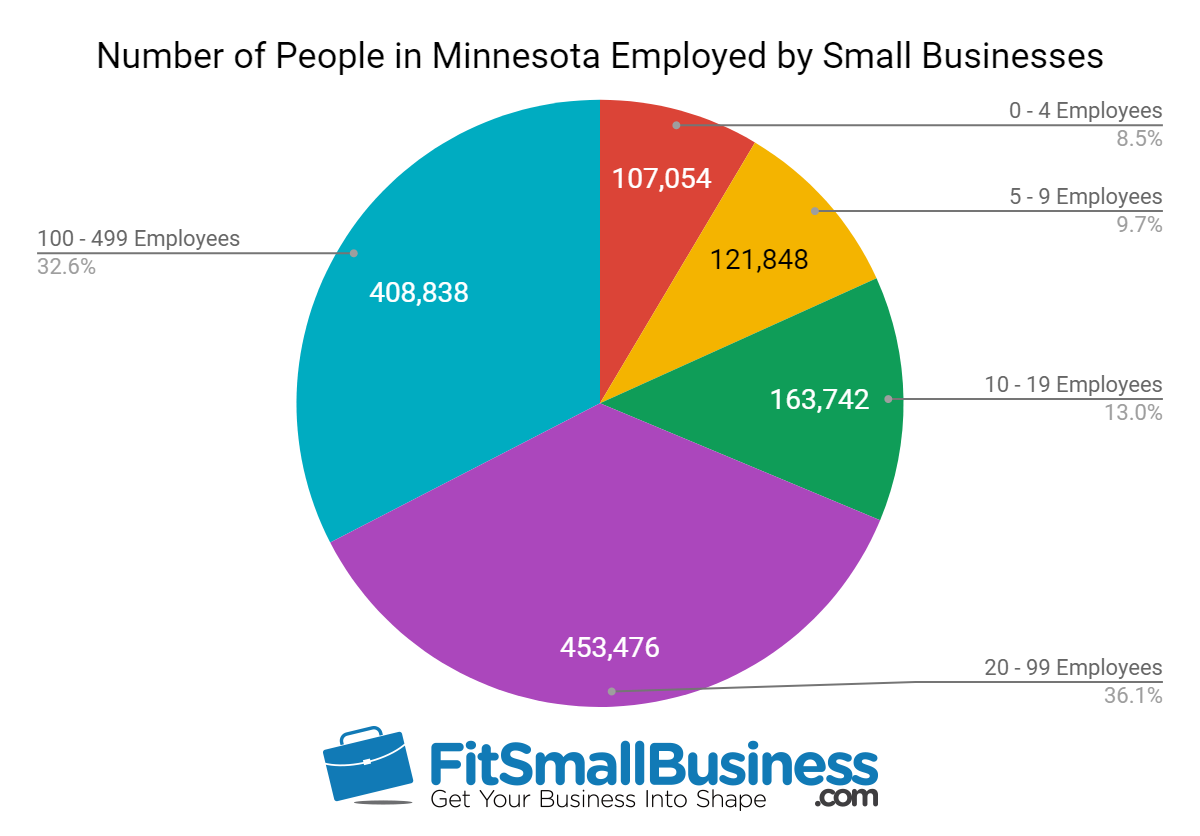
Source: SBA & SUSB Data
Minnesota SBA Franchise Loan Statistics
The SBA loan statistics for franchise financing in Minnesota from 2010 to 2018 are:
- Number of SBA Franchise Loans Made from 2010 to 2018: 917
- Top Franchise Funded by SBA Loans in Minnesota: Anytime Fitness
Of the 917 SBA franchise loans made in Minnesota between 2010 and 2018, 51 loans went to borrowers financing an Anytime Fitness franchise.
26. Mississippi SBA Statistics and Small Business Industry Statistics
As of 2016, small businesses employed 440,399 people in the state of Mississippi. Nearly $109 million in SBA loan funds went to small businesses in Mississippi in 2018 alone. The leading industry supported with SBA loan funds between 2010 and 2018 was the agriculture and forestry industry, which received 1,582 loans. However, the agriculture and forestry industry is not one of the top three small business industries in the state. The top franchise financed by SBA loans in Mississippi was Subway Sandwich.
The SBA loan statistics and other small business industry statistics we evaluated for Mississippi are:
Mississippi SBA Loan Statistics
The primary SBA loan statistics for the state of Mississippi are:
- Top SBA Lender: Trustmark National Bank
- Number of SBA Loans Approved in 2018: 374
- Total Dollar Amount of SBA Loans Approved in 2018: $108,795,537
- Average Interest Rate of SBA Loans Made in 2018: 6.5%
- Average Loan Term for SBA Loans Made in 2018: 10 Years
- Average Default Rate of SBA Loans from 2010 to 2018: 14.1%
Trustmark National Bank is a regional bank serving the southeast United States. Trustmark National Bank originated 56 loans totaling $4,304,505 in the state of Mississippi in fiscal year 2018. This represented 14.9% of the total number of SBA loans made in the state.
Mississippi Small Business Industry Statistics
The three NAICS codes for small businesses employing the largest number of people in Mississippi, and the number of SBA loans made in those industries are:
| Ranking |
|
|
|
|
|---|---|---|---|---|
| 1 |
|
|
|
|
| 2 |
|
|
|
|
| 3 |
|
|
|
|
| 15 |
|
|
|
|
Mississippi Small Business Employment Statistics
The number of people employed by small businesses in Mississippi, and the number of jobs supported by SBA loans are:
- Number of People in Mississippi Employed by Small Businesses: 440,399
- Number of Jobs Supported by SBA Loans from 2010 to 2018: 36,949
- Percent of Jobs Supported by SBA Loans from 2010 to 2018: 8.4%
- Number of Jobs Supported by SBA Loans in 2018: 3,283
- Percent of Jobs Supported by SBA Loans in 2018: 0.7%
SBA loan funds helped support roughly 8% of the jobs created by small businesses in the state of Mississippi from 2010 to 2018.
Number of People in Mississippi Employed by Small Businesses
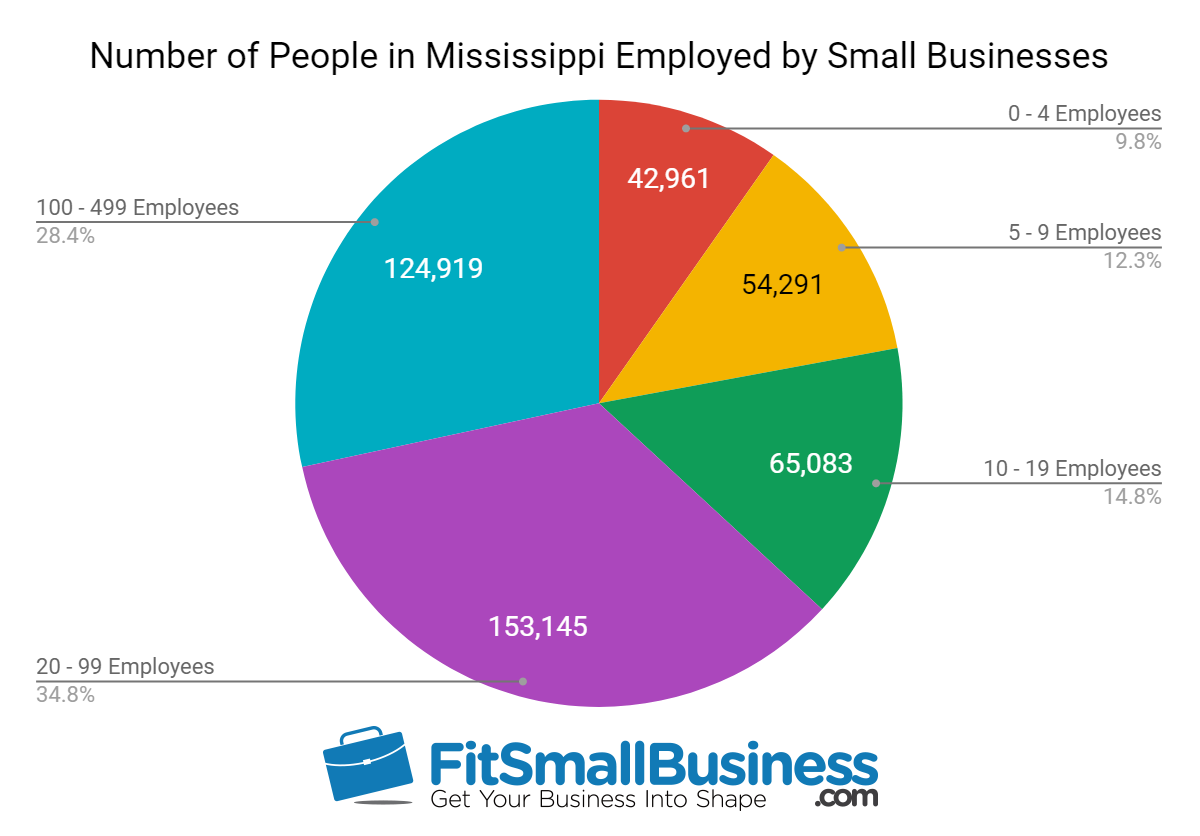
Source: SBA & SUSB Data
Mississippi SBA Franchise Loan Statistics
The SBA loan statistics for franchise financing in Mississippi from 2010 to 2018 are:
- Number of SBA Franchise Loans Made from 2010 to 2018: 242
- Top Franchise Funded by SBA Loans in Mississippi: Subway Sandwich
Of the 242 SBA franchise loans made in Mississippi between 2010 and 2018, 13 loans went to borrowers financing a Subway Sandwich franchise. Subway was in the list of the top 50 franchises as determined by SBA loan default rates from 2010 to 2018.
27. Missouri SBA Statistics and Small Business Industry Statistics
As of 2016, small businesses employed 1,168,725 people in the state of Missouri. Over $333 million in SBA loan funds went to small businesses in Missouri in 2018 alone. The leading industry supported with SBA loan funds between 2010 and 2018 was the accommodation and food service industry, which received 1,218 loans, and is one of the top three small business industries in the state. The top franchise financed by SBA loans in Missouri was Anytime Fitness.
The SBA loan statistics and other small business industry statistics we evaluated for Missouri are:
Missouri SBA Loan Statistics
The primary SBA loan statistics for the state of Missouri are:
- Top SBA Lender: U.S. Bank
- Number of SBA Loans Approved in 2018: 938
- Total Dollar Amount of SBA Loans Approved in 2018: $333,463,139
- Average Interest Rate of SBA Loans Made in 2018: 6.9%
- Average Loan Term for SBA Loans Made in 2018: 11 Years
- Average Default Rate of SBA Loans from 2010 to 2018: 14.6%
In 2018, U.S. Bank was one of the top 100 SBA lenders, as well as being the top lender in Missouri. U.S. Bank originated 113 loans totaling $7,116,475 in the state of Missouri in fiscal year 2018. This represented 12% of the total number of SBA loans made in the state.
Missouri Small Business Industry Statistics
The three NAICS codes for small businesses employing the largest number of people in Missouri, and the number of SBA loans made in those industries are:
| Ranking |
|
|
|
|
|---|---|---|---|---|
| 1 |
|
|
|
|
| 2 |
|
|
|
|
| 3 |
|
|
|
|
Missouri Small Business Employment Statistics
The number of people employed by small businesses in Missouri, and the number of jobs supported by SBA loans are:
- Number of People in Missouri Employed by Small Businesses: 1,168,725
- Number of Jobs Supported by SBA Loans from 2010 to 2018: 106,997
- Percent of Jobs Supported by SBA Loans from 2010 to 2018: 9.2%
- Number of Jobs Supported by SBA Loans in 2018: 10,268
- Percent of Jobs Supported by SBA Loans in 2018: 0.9%
SBA loan funds helped support roughly 9% of the jobs created by small businesses in the state of Missouri from 2010 to 2018.
Number of People in Missouri Employed by Small Businesses
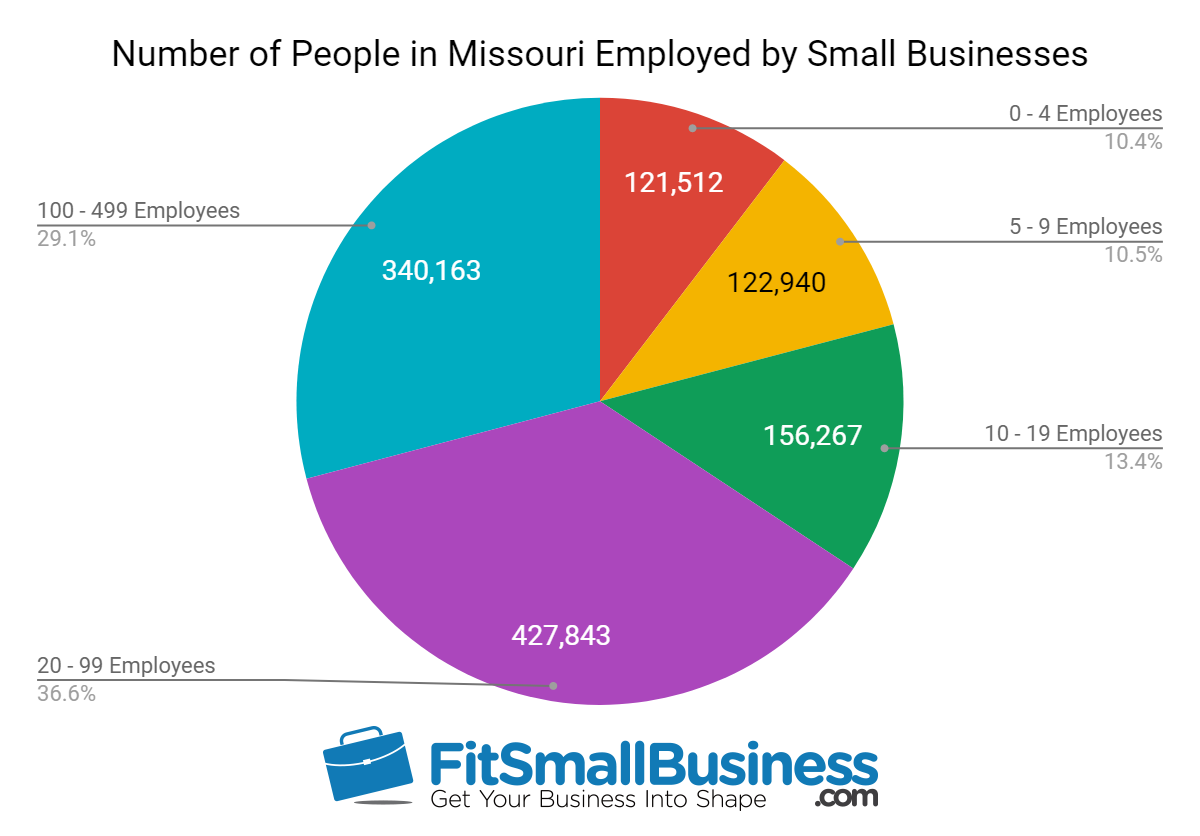
Source: SBA & SUSB Data
Missouri SBA Franchise Loan Statistics
The SBA loan statistics for franchise financing in Missouri from 2010 to 2018 are:
- Number of SBA Franchise Loans Made from 2010 to 2018: 716
- Top Franchise Funded by SBA Loans in Missouri: Anytime Fitness
Of the 716 SBA franchise loans made in Missouri between 2010 and 2018, 20 loans went to borrowers financing an Anytime Fitness franchise.
28. Montana SBA Statistics and Small Business Industry Statistics
As of 2016, small businesses employed 245,411 people in the state of Montana. Over $47 million in SBA loan funds went to small businesses in Montana in 2018 alone. The leading industry supported with SBA loan funds between 2010 and 2018 was the accommodation and food service industry, which received 399 loans. However, the construction industry is not one of the top three small business industries in the state. The top franchise financed by SBA loans in Montana was Subway Sandwich.
The SBA loan statistics and other small business industry statistics we evaluated for Montana are:
Montana SBA Loan Statistics
The primary SBA loan statistics for the state of Montana are:
- Top SBA Lender: Glacier Bank
- Number of SBA Loans Approved in 2018: 223
- Total Dollar Amount of SBA Loans Approved in 2018: $47,306,672
- Average Interest Rate of SBA Loans Made in 2018: 6.8%
- Average Loan Term for SBA Loans Made in 2018: 10 Years
- Average Default Rate of SBA Loans from 2010 to 2018: 12.0%
Glacier Bank is a local bank serving businesses in Montana and surrounding states. Glacier Bank originated 54 loans totaling $7,368,415 in the state of Montana in fiscal year 2018. This represented 24.2% of the total number of SBA loans made in the state.
Montana Small Business Industry Statistics
The three NAICS codes for small businesses employing the largest number of people in Montana, and the number of SBA loans made in those industries are:
| Ranking |
|
|
|
|
|---|---|---|---|---|
| 1 |
|
|
|
|
| 2 |
|
|
|
|
| 3 |
|
|
|
|
| 4 |
|
|
|
|
Montana Small Business Employment Statistics
The number of people employed by small businesses in Montana, and the number of jobs supported by SBA loans are:
- Number of People in Montana Employed by Small Businesses: 245,411
- Number of Jobs Supported by SBA Loans from 2010 to 2018: 106,997
- Percent of Jobs Supported by SBA Loans from 2010 to 2018: 43.6%
- Number of Jobs Supported by SBA Loans in 2018: 1,789
- Percent of Jobs Supported by SBA Loans in 2018: 0.7%
SBA loan funds helped support roughly 44% of the jobs created by small businesses in the state of Montana from 2010 to 2018.
Number of People in Montana Employed by Small Businesses
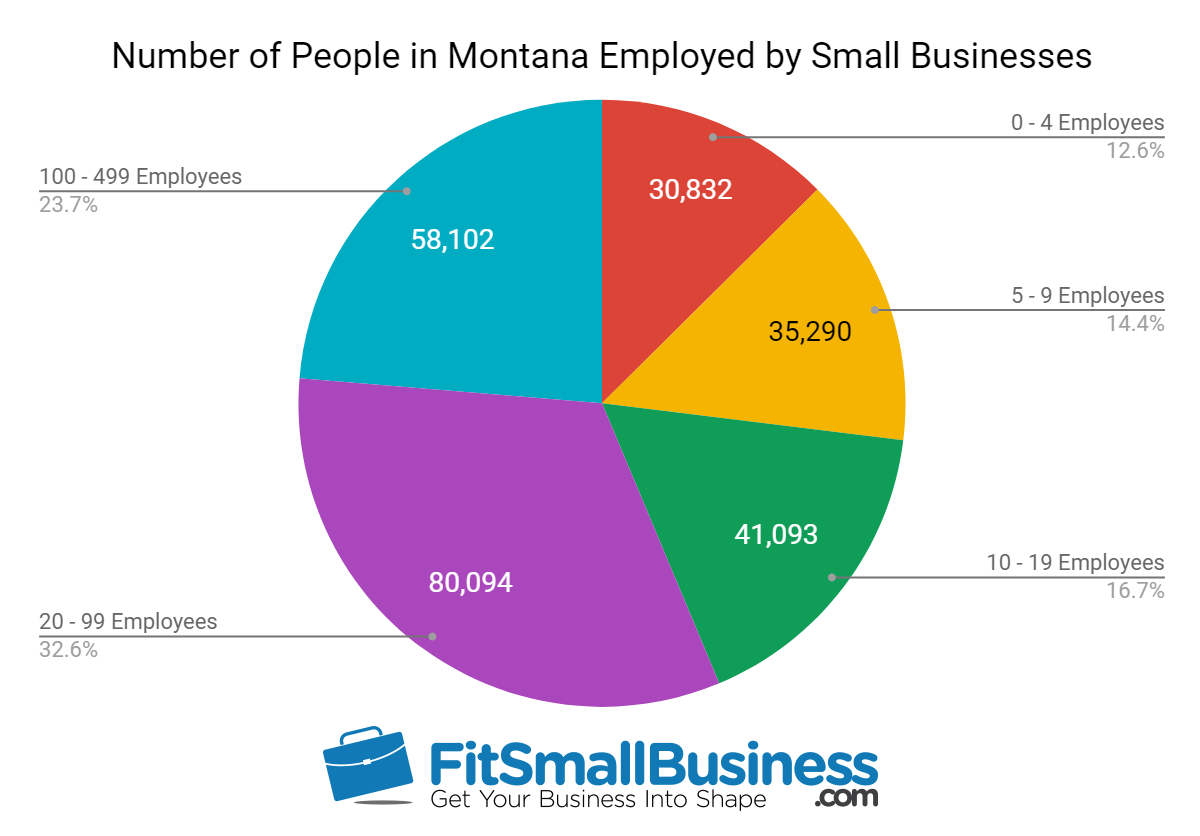
Source: SBA & SUSB Data
Montana SBA Franchise Loan Statistics
The SBA loan statistics for franchise financing in Montana from 2010 to 2018 are:
- Number of SBA Franchise Loans Made from 2010 to 2018: 149
- Top Franchise Funded by SBA Loans in Montana: Subway Sandwich
Of the 149 SBA franchise loans made in Montana between 2010 and 2018, 15 loans went to borrowers financing a Subway Sandwich franchise. Subway was in the list of the top 50 franchises as determined by SBA loan default rates from 2010 to 2018.
29. Nebraska SBA Statistics and Small Business Industry Statistics
As of 2016, small businesses employed 412,291 people in the state of Nebraska. Nearly $71 million in SBA loan funds went to small businesses in Nebraska in 2018 alone. The leading industry supported with SBA loan funds between 2010 and 2018 was the construction industry, which received 922 loans. However, the construction industry is not one of the top three small business industries in the state. The top franchise financed by SBA loans in Nebraska was Sport Clips.
The SBA loan statistics and other small business industry statistics we evaluated for Nebraska are:
Nebraska SBA Loan Statistics
The primary SBA loan statistics for the state of Nebraska are:
- Top SBA Lender: First National Bank of Omaha
- Number of SBA Loans Approved in 2018: 304
- Total Dollar Amount of SBA Loans Approved in 2018: $70,779,541
- Average Interest Rate of SBA Loans Made in 2018: 6.5%
- Average Loan Term for SBA Loans Made in 2018: 9 Years
- Average Default Rate of SBA Loans from 2010 to 2018: 12.9%
First National Bank of Omaha operates in seven states, including Nebraska. First National Bank of Omaha originated 37 loans totaling $6,537,970 in the state of Nebraska in fiscal year 2018. This represented 12% of the total number of SBA loans made in the state.
Nebraska Small Business Industry Statistics
The three NAICS codes for small businesses employing the largest number of people in Nebraska, and the number of SBA loans made in those industries are:
| Ranking | NAICS Code |
|
|
|
|---|---|---|---|---|
| 1 |
|
|
|
|
| 2 |
|
|
|
|
| 3 |
|
|
|
|
| 4 |
|
|
|
|
Nebraska Small Business Employment Statistics
The number of people employed by small businesses in Nebraska, and the number of jobs supported by SBA loans are:
- Number of People in Nebraska Employed by Small Businesses: 412,291
- Number of Jobs Supported by SBA Loans from 2010 to 2018: 42,992
- Percent of Jobs Supported by SBA Loans from 2010 to 2018: 10.4%
- Number of Jobs Supported by SBA Loans in 2018: 3,810
- Percent of Jobs Supported by SBA Loans in 2018: 0.9%
SBA loan funds helped support roughly 10% of the jobs created by small businesses in the state of Nebraska from 2010 to 2018.
Number of People in Nebraska Employed by Small Businesses
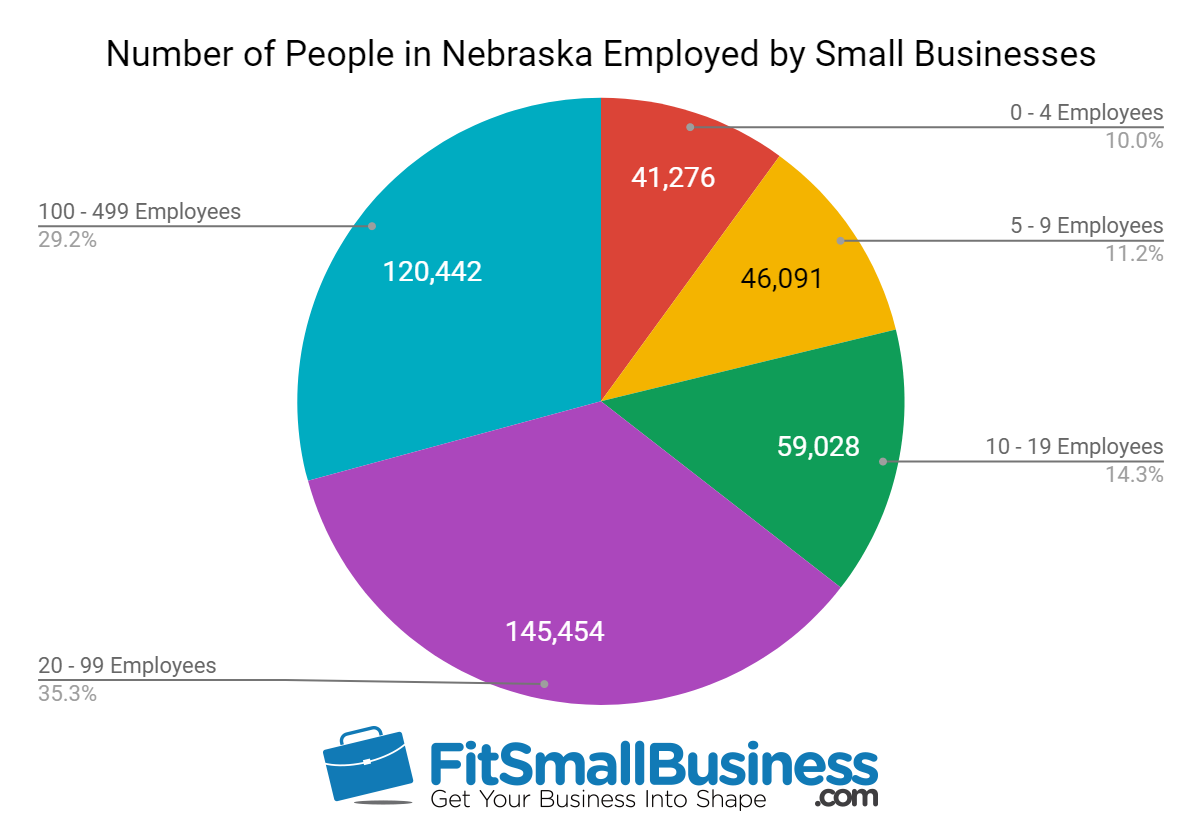
Source: SBA & SUSB Data
Nebraska SBA Franchise Loan Statistics
The SBA loan statistics for franchise financing in Nebraska from 2010 to 2018 are:
- Number of SBA Franchise Loans Made from 2010 to 2018: 247
- Top Franchise Funded by SBA Loans in Nebraska: Sport Clips
Of the 247 SBA franchise loans made in Nebraska between 2010 and 2018, 10 loans went to borrowers financing a Sport Clips franchise.
30. Nevada SBA Statistics and Small Business Industry Statistics
As of 2016, small businesses employed 487,407 people in the state of Nevada. Over $153 million in SBA loan funds went to small businesses in Nevada in 2018 alone. The leading industry supported with SBA loan funds between 2010 and 2018 was the accommodation and food service industry, which received 420 loans, and is one of the top three small business industries in the state. The top franchise financed by SBA loans in Nevada was Jimmy John’s.
The SBA loan statistics and other small business industry statistics we evaluated for Nevada are:
Nevada SBA Loan Statistics
The primary SBA loan statistics for the state of Nevada are:
- Top SBA Lender: Wells Fargo
- Number of SBA Loans Approved in 2018: 528
- Total Dollar Amount of SBA Loans Approved in 2018: $153,085,520
- Average Interest Rate of SBA Loans Made in 2018: 7.7%
- Average Loan Term for SBA Loans Made in 2018: 11 Years
- Average Default Rate of SBA Loans from 2010 to 2018: 14.2%
For 2018, Wells Fargo was the top SBA lender in the state of Nevada, as well as nationally. Wells Fargo originated 81 loans totaling $12,168,000 in the state of Nevada in fiscal year 2018. This represented 15.3% of the total number of SBA loans made in the state.
Nevada Small Business Industry Statistics
The three NAICS codes for small businesses employing the largest number of people in Nevada, and the number of SBA loans made in those industries are:
| Ranking |
|
|
|
|
|---|---|---|---|---|
| 1 |
|
|
|
|
| 2 |
|
|
|
|
| 3 |
|
|
|
|
Nevada Small Business Employment Statistics
The number of people employed by small businesses in Nevada, and the number of jobs supported by SBA loans are:
- Number of People in Nevada Employed by Small Businesses: 487,407
- Number of Jobs Supported by SBA Loans from 2010 to 2018: 43,082
- Percent of Jobs Supported by SBA Loans from 2010 to 2018: 8.8%
- Number of Jobs Supported by SBA Loans in 2018: 6,019
- Percent of Jobs Supported by SBA Loans in 2018: 1.2%
SBA loan funds helped support roughly 9% of the jobs created by small businesses in the state of Nevada from 2010 to 2018.
Number of People in Nevada Employed by Small Businesses
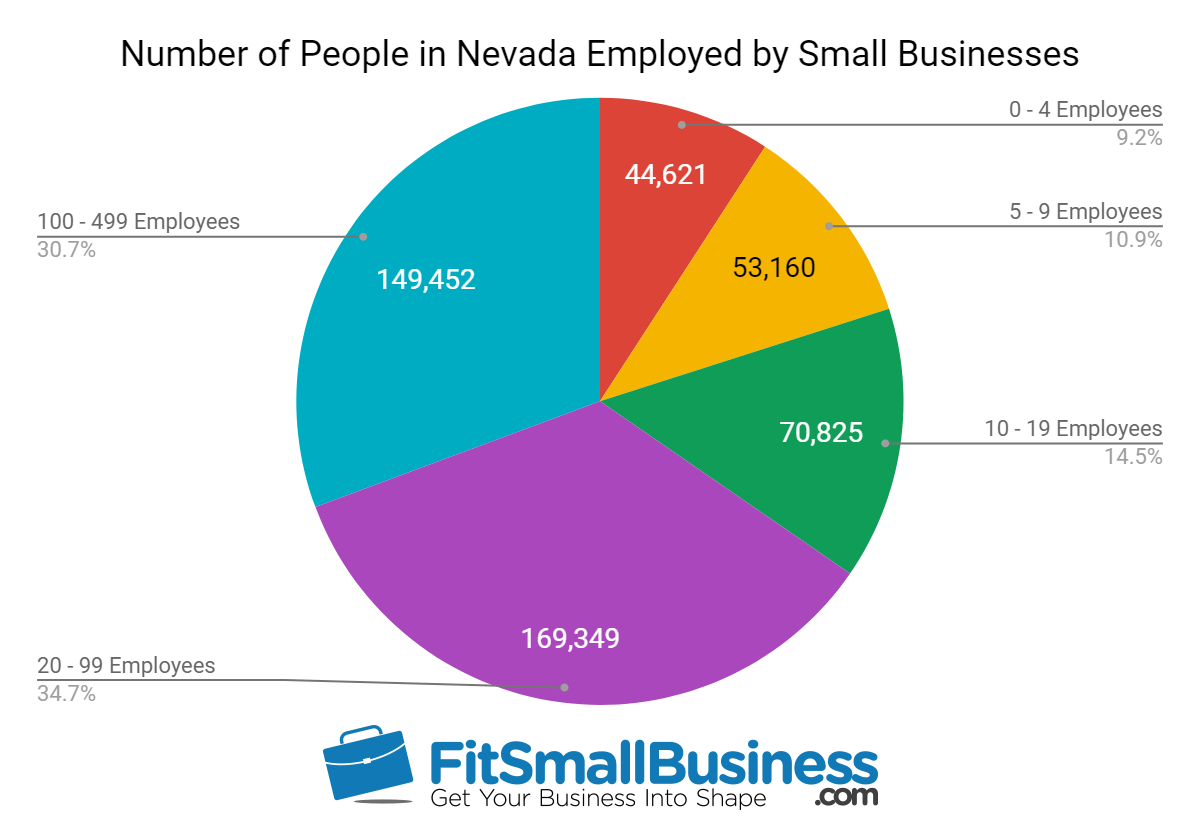
Source: SBA & SUSB Data
Nevada SBA Franchise Loan Statistics
The SBA loan statistics for franchise financing in Nevada from 2010 to 2018 are:
- Number of SBA Franchise Loans Made from 2010 to 2018: 260
- Top Franchise Funded by SBA Loans in Nevada: Jimmy John’s
Of the 260 SBA franchise loans made in Nevada between 2010 and 2018, 11 loans went to borrowers financing a Jimmy John’s franchise. Jimmy John’s was in the list of the top 50 franchises as determined by SBA loan default rates from 2010 to 2018.
31. New Hampshire SBA Statistics and Small Business Industry Statistics
As of 2016, small businesses employed 295,895 people in the state of New Hampshire. Nearly $73 million in SBA loan funds went to small businesses in New Hampshire in 2018 alone. The leading industry supported with SBA loan funds between 2010 and 2018 was the construction industry, which received 675 loans. However, the construction industry is not one of the top three small business industries in the state. The top franchise financed by SBA loans in New Hampshire was Aroma Joe’s.
The SBA loan statistics and other small business industry statistics we evaluated for New Hampshire are:
New Hampshire SBA Loan Statistics
The primary SBA loan statistics for the state of New Hampshire are:
- Top SBA Lender: TD Bank
- Number of SBA Loans Approved in 2018: 576
- Total Dollar Amount of SBA Loans Approved in 2018: $72,635,750
- Average Interest Rate of SBA Loans Made in 2018: 7.3%
- Average Loan Term for SBA Loans Made in 2018: 8 Years
- Average Default Rate of SBA Loans from 2010 to 2018: 11.3%
New Hampshire’s top SBA lender in 2018 was TD Bank, a regional bank serving the East Coast. Additionally, TD Bank is one of the top 100 SBA lenders for 2018 nationally. TD Bank originated 127 loans totaling $4,020,600 in the state of New Hampshire in fiscal year 2018. This represented 22% of the total number of SBA loans made in the state.
New Hampshire Small Business Industry Statistics
The three NAICS codes for small businesses employing the largest number of people in New Hampshire, and the number of SBA loans made in those industries are:
| Ranking |
|
|
|
|
|---|---|---|---|---|
| 1 | 62 - Health Care and
|
|
|
|
| 2 |
|
|
|
|
| 3 |
|
|
|
|
| 5 |
|
|
|
|
New Hampshire Small Business Employment Statistics
The number of people employed by small businesses in New Hampshire, and the number of jobs supported by SBA loans are:
- Number of People in New Hampshire Employed by Small Businesses: 295,895
- Number of Jobs Supported by SBA Loans from 2010 to 2018: 38,582
- Percent of Jobs Supported by SBA Loans from 2010 to 2018: 13%
- Number of Jobs Supported by SBA Loans in 2018: 4,376
- Percent of Jobs Supported by SBA Loans in 2018: 1.5%
SBA loan funds helped support roughly 13% of the jobs created by small businesses in the state of New Hampshire from 2010 to 2018.
Number of People in New Hampshire Employed by Small Businesses
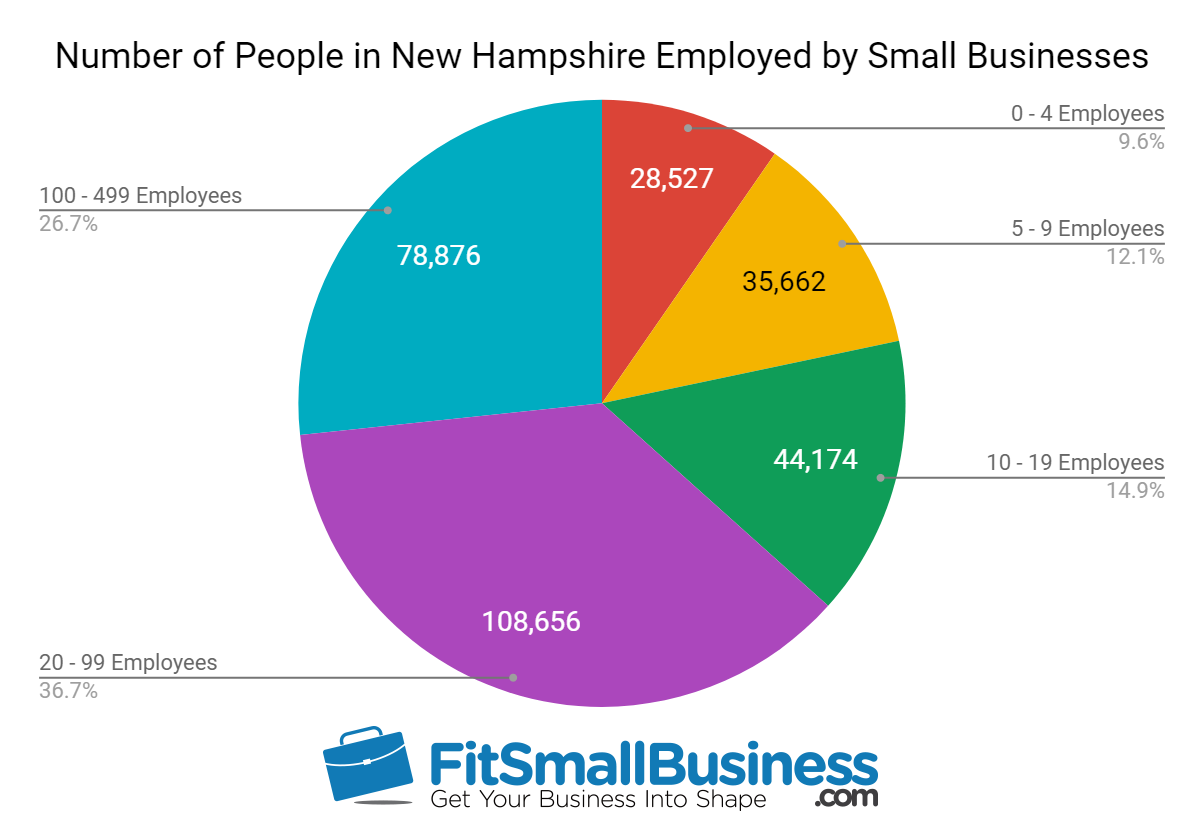
Source: SBA & SUSB Data
New Hampshire SBA Franchise Loan Statistics
The SBA loan statistics for franchise financing in New Hampshire from 2010 to 2018 are:
- Number of SBA Franchise Loans Made from 2010 to 2018: 160
- Top Franchise Funded by SBA Loans in New Hampshire: Aroma Joe’s
Of the 160 SBA franchise loans made in New Hampshire between 2010 and 2018, nine loans went to borrowers financing an Aroma Joe’s franchise.
32. New Jersey SBA Statistics and Small Business Industry Statistics
As of 2016, small businesses employed 1,810,107 people in the state of New Jersey. Over $605 million in SBA loan funds went to small businesses in New Jersey in 2018 alone. The leading industry supported with SBA loan funds between 2010 and 2018 was the accommodation and food service industry, which received 1,964 loans, and is one of the top three small business industries in the state. The top franchise financed by SBA loans in New Jersey was Dunkin’ Donuts.
The SBA loan statistics and other small business industry statistics we evaluated for New Jersey are:
New Jersey SBA Loan Statistics
The primary SBA loan statistics for the state of New Jersey are:
- Top SBA Lender: TD Bank
- Number of SBA Loans Approved in 2018: 2,214
- Total Dollar Amount of SBA Loans Approved in 2018: $605,381,711
- Average Interest Rate of SBA Loans Made in 2018: 8.1%
- Average Loan Term for SBA Loans Made in 2018: 10 Years
- Average Default Rate of SBA Loans from 2010 to 2018: 14.9%
In 2018, TD Bank, a regional bank serving the East Coast, was the top SBA lender in New Jersey as well as one of the top 100 SBA lenders nationally. TD Bank originated 851 loans totaling $57,965,900 in the state of New Jersey in fiscal year 2018. This represented 38.4% of the total number of SBA loans made in the state.
New Jersey Small Business Industry Statistics
The three NAICS codes for small businesses employing the largest number of people in New Jersey, and the number of SBA loans made in those industries are:
| Ranking |
|
|
|
|
|---|---|---|---|---|
| 1 |
|
|
|
|
| 2 |
|
|
|
|
| 3 |
|
|
|
|
New Jersey Small Business Employment Statistics
The number of people employed by small businesses in New Jersey, and the number of jobs supported by SBA loans are:
- Number of People in New Jersey Employed by Small Businesses: 1,810,107
- Number of Jobs Supported by SBA Loans from 2010 to 2018: 126,527
- Percent of Jobs Supported by SBA Loans from 2010 to 2018: 6.9%
- Number of Jobs Supported by SBA Loans in 2018: 16,227
- Percent of Jobs Supported by SBA Loans in 2018: 0.9%
SBA loan funds helped support roughly 7% of the jobs created by small businesses in the state of New Jersey from 2010 to 2018.
Number of People in New Jersey Employed by Small Businesses

Source: SBA & SUSB Data
New Jersey SBA Franchise Loan Statistics
The SBA loan statistics for franchise financing in New Jersey from 2010 to 2018 are:
- Number of SBA Franchise Loans Made from 2010 to 2018: 998
- Top Franchise Funded by SBA Loans in New Jersey: Dunkin’ Donuts
Of the 998 SBA franchise loans made in New Jersey between 2010 and 2018, 44 loans went to borrowers financing a Dunkin’ Donuts franchise.
33. New Mexico SBA Statistics and Small Business Industry Statistics
As of 2016, small businesses employed 334,945 people in the state of New Mexico. Nearly $88 million in SBA loan funds went to small businesses in New Mexico in 2018 alone. The leading industry supported with SBA loan funds between 2010 and 2018 was the healthcare and social assistance industry, which received 283 loans, and is one of the top three small business industries in the state. The top franchise financed by SBA loans in New Mexico was Subway Sandwich.
The SBA loan statistics and other small business industry statistics we evaluated for New Mexico are:
New Mexico SBA Loan Statistics
The primary SBA loan statistics for the state of New Mexico are:
- Top SBA Lender: Wells Fargo
- Number of SBA Loans Approved in 2018: 227
- Total Dollar Amount of SBA Loans Approved in 2018: $87,713,450
- Average Interest Rate of SBA Loans Made in 2018: 7.1%
- Average Loan Term for SBA Loans Made in 2018: 13 Years
- Average Default Rate of SBA Loans from 2010 to 2018: 14.7%
During the year 2018, Wells Fargo originated the most SBA loans in New Mexico. The company is at the top of the list of the most active SBA lenders nationally, and so this is unsurprising. Wells Fargo originated 40 loans totaling $4,381,175 in the state of New Mexico in fiscal year 2018. This represented 17.6% of the total number of SBA loans made in the state.
New Mexico Small Business Industry Statistics
The three NAICS codes for small businesses employing the largest number of people in New Mexico, and the number of SBA loans made in those industries are:
| Ranking |
|
|
|
|
|---|---|---|---|---|
| 1 |
|
|
|
|
| 2 |
|
|
|
|
| 3 |
|
|
|
|
New Mexico Small Business Employment Statistics
The number of people employed by small businesses in New Mexico, and the number of jobs supported by SBA loans are:
- Number of People in New Mexico Employed by Small Businesses: 334,945
- Number of Jobs Supported by SBA Loans from 2010 to 2018: 26,640
- Percent of Jobs Supported by SBA Loans from 2010 to 2018: 7.9%
- Number of Jobs Supported by SBA Loans in 2018: 2,665
- Percent of Jobs Supported by SBA Loans in 2018: 0.8%
SBA loan funds helped support roughly 8% of the jobs created by small businesses in the state of New Mexico from 2010 to 2018.
Number of People in New Mexico Employed by Small Businesses
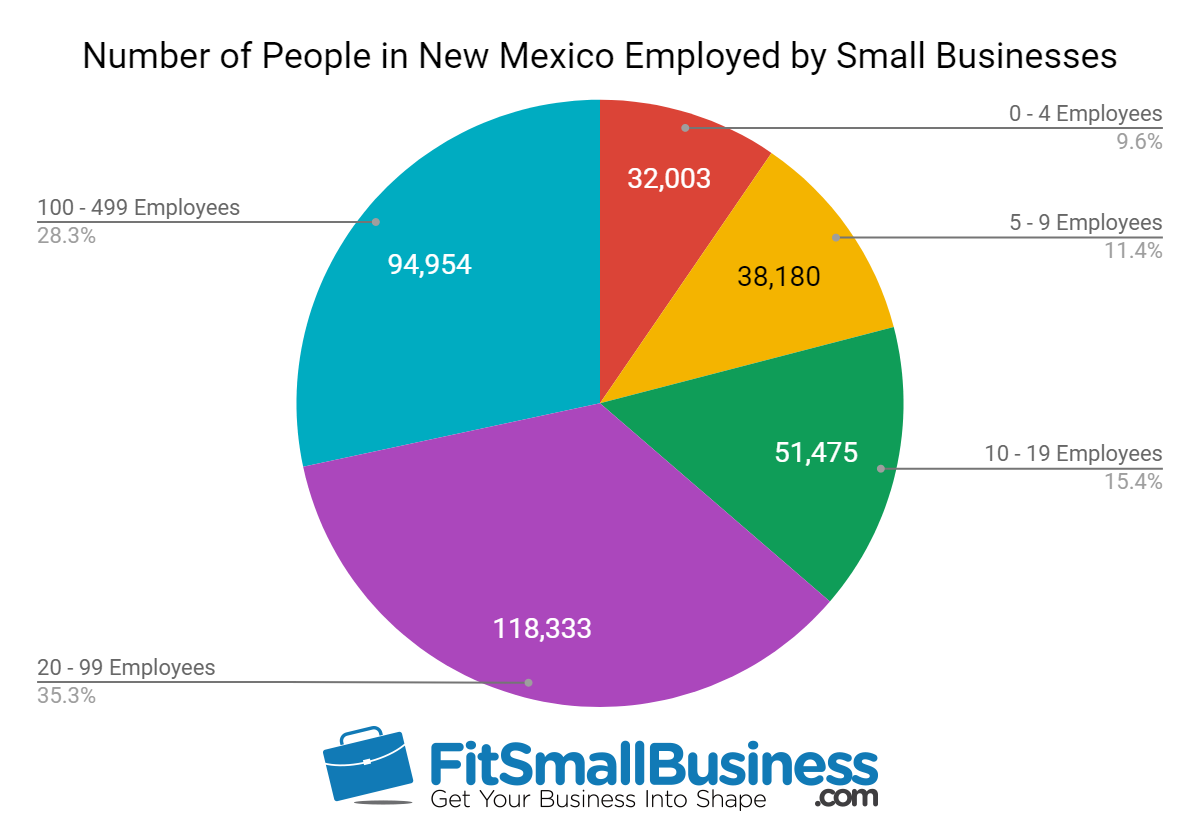
Source: SBA & SUSB Data
New Mexico SBA Franchise Loan Statistics
The SBA loan statistics for franchise financing in New Mexico from 2010 to 2018 are:
- Number of SBA Franchise Loans Made from 2010 to 2018: 139
- Top Franchise Funded by SBA Loans in New Mexico: Subway Sandwich
Of the 139 SBA franchise loans made in New Mexico between 2010 and 2018, 12 loans went to borrowers financing a Subway Sandwich franchise. Subway was in the list of the top 50 franchises as determined by SBA loan default rates from 2010 to 2018.
34. New York SBA Statistics and Small Business Industry Statistics
As of 2016, small businesses employed 4,106,086 people in the state of New York. Nearly $781 million in SBA loan funds went to small businesses in New York in 2018 alone. The leading industry supported with SBA loan funds between 2010 and 2018 was the accommodation and food service industry, which received 4,170 loans, and is one of the top three small business industries in the state. The top franchise financed by SBA loans in New York was Subway Sandwich.
The SBA loan statistics and other small business industry statistics we evaluated for New York are:
New York SBA Loan Statistics
The primary SBA loan statistics for the state of New York are:
- Top SBA Lender: TD Bank
- Number of SBA Loans Approved in 2018: 4,385
- Total Dollar Amount of SBA Loans Approved in 2018: $780,614,315
- Average Interest Rate of SBA Loans Made in 2018: 7.8%
- Average Loan Term for SBA Loans Made in 2018: 9 Years
- Average Default Rate of SBA Loans from 2010 to 2018: 13.3%
SBA loan funds helped support roughly 8% of the jobs created by small businesses in the state of New York from 2010 to 2018.
New York’s leading SBA lender in 2018 was TD Bank, a regional bank serving the east coast. Additionally, TD Bank is one of the top 100 SBA lenders nationally for 2018. TD Bank originated 1,200 loans totaling $44,040,100 in the state of New York in fiscal year 2018. This represented 27.4% of the total number of SBA loans made in the state.
New York Small Business Industry Statistics
The three NAICS codes for small businesses employing the largest number of people in New York, and the number of SBA loans made in those industries are:
| Ranking |
|
|
|
|
|---|---|---|---|---|
| 1 |
|
|
|
|
| 2 |
|
|
|
|
| 3 |
|
|
|
|
New York Small Business Employment Statistics
The number of people employed by small businesses in New York, and the number of jobs supported by SBA loans are:
- Number of People in New York Employed by Small Businesses: 4,106,086
- Number of Jobs Supported by SBA Loans from 2010 to 2018: 273,350
- Percent of Jobs Supported by SBA Loans from 2010 to 2018: 6.7%
- Number of Jobs Supported by SBA Loans in 2018: 26,125
- Percent of Jobs Supported by SBA Loans in 2018: 0.6%
Number of People in New York Employed by Small Businesses
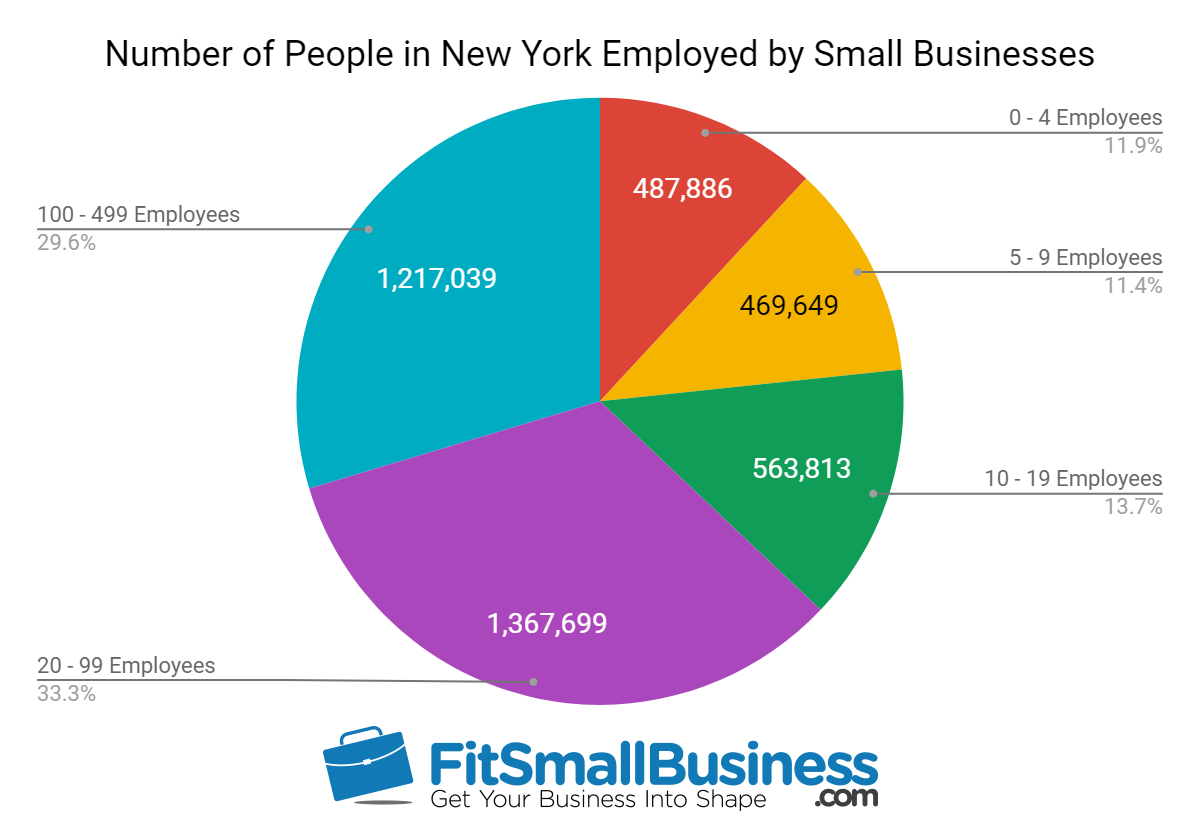
Source: SBA & SUSB Data
New York SBA Franchise Loan Statistics
The SBA loan statistics for franchise financing in New York from 2010 to 2018 are:
- Number of SBA Franchise Loans Made from 2010 to 2018: 1,013
- Top Franchise Funded by SBA Loans in New York: Subway Sandwich
Of the 1,013 SBA franchise loans made in New York between 2010 and 2018, 81 loans went to borrowers financing a Subway Sandwich franchise. Subway was in the list of the top 50 franchises as determined by SBA loan default rates from 2010 to 2018.
35. North Carolina SBA Statistics and Small Business Industry Statistics
As of 2016, small businesses employed 1,672,050 people in the state of North Carolina. Nearly $564 million in SBA loan funds went to small businesses in North Carolina in 2018 alone. The leading industry supported with SBA loan funds between 2010 and 2018 was the accommodation and food service industry, which received 1,417 loans, and is one of the top three small business industries in the state. The top franchise financed by SBA loans in North Carolina was Days Inn.
The SBA loan statistics and other small business industry statistics we evaluated for North Carolina are:
North Carolina SBA Loan Statistics
The primary SBA loan statistics for the state of North Carolina are:
- Top SBA Lender: Wells Fargo
- Number of SBA Loans Approved in 2018: 1,292
- Total Dollar Amount of SBA Loans Approved in 2018: $563,617,820
- Average Interest Rate of SBA Loans Made in 2018: 7.2%
- Average Loan Term for SBA Loans Made in 2018: 12 Years
- Average Default Rate of SBA Loans from 2010 to 2018: 13.0%
In evaluating SBA loan originations for 2018, Wells Fargo is the top SBA lender for North Carolina. It carries this same title nationally, and so this is not unexpected. Wells Fargo originated 179 loans totaling $27,278,535 in the state of North Carolina in fiscal year 2018. This represented 13.9% of the total number of SBA loans made in the state.
North Carolina Small Business Industry Statistics
The three NAICS codes for small businesses employing the largest number of people in North Carolina, and the number of SBA loans made in those industries are:
| Ranking |
|
|
|
|
|---|---|---|---|---|
| 1 |
|
|
|
|
| 2 |
|
|
|
|
| 3 |
|
|
|
|
North Carolina Small Business Employment Statistics
The number of people employed by small businesses in North Carolina, and the number of jobs supported by SBA loans are:
- Number of People in North Carolina Employed by Small Businesses: 1,672,050
- Number of Jobs Supported by SBA Loans from 2010 to 2018: 106,850
- Percent of Jobs Supported by SBA Loans from 2010 to 2018: 6.4%
- Number of Jobs Supported by SBA Loans in 2018: 15,096
- Percent of Jobs Supported by SBA Loans in 2018: 0.9%
SBA loan funds helped support roughly 6% of the jobs created by small businesses in the state of North Carolina from 2010 to 2018.
Number of People in North Carolina Employed by Small Businesses
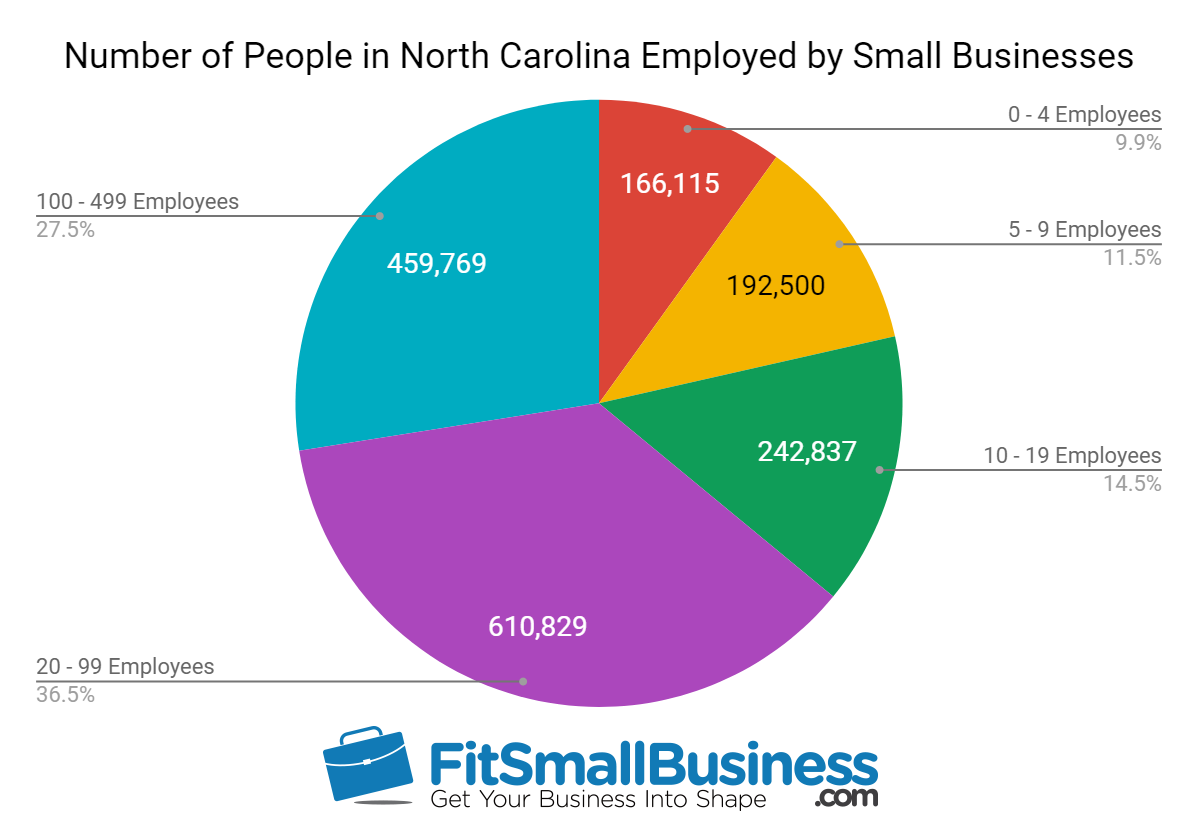
Source: SBA & SUSB Data
North Carolina SBA Franchise Loan Statistics
The SBA loan statistics for franchise financing in North Carolina from 2010 to 2018 are:
- Number of SBA Franchise Loans Made from 2010 to 2018: 965
- Top Franchise Funded by SBA Loans in North Carolina: Days Inn
Of the 965 SBA franchise loans made in North Carolina between 2010 and 2018, 26 loans went to borrowers financing a Days Inn franchise.
36. North Dakota SBA Statistics and Small Business Industry Statistics
As of 2016, small businesses employed 198,964 people in the state of North Dakota. Nearly $25 million in SBA loan funds went to small businesses in North Dakota in 2018 alone. The leading industry supported with SBA loan funds between 2010 and 2018 was the construction industry, which received 285 loans. However, the construction industry is not one of the top three small business industries in the state. The top franchise financed by SBA loans in North Dakota was ServiceMaster.
The SBA loan statistics and other small business industry statistics we evaluated for North Dakota are:
North Dakota SBA Loan Statistics
The primary SBA loan statistics for the state of North Dakota are:
- Top SBA Lender: VISIONBank
- Number of SBA Loans Approved in 2018: 169
- Total Dollar Amount of SBA Loans Approved in 2018: $24,806,067
- Average Interest Rate of SBA Loans Made in 2018: 6.4%
- Average Loan Term for SBA Loans Made in 2018: 8 Years
- Average Default Rate of SBA Loans from 2010 to 2018: 12.7%
VISIONBank is a local bank serving businesses in North Dakota. VISIONBank originated 32 loans totaling $1,693,100 in the state of North Dakota in fiscal year 2018. This represented 18.9% of the total number of SBA loans made in the state.
North Dakota Small Business Industry Statistics
The three NAICS codes for small businesses employing the largest number of people in North Dakota, and the number of SBA loans made in those industries are:
| Ranking |
|
|
|
|
|---|---|---|---|---|
| 1 |
|
|
|
|
| 2 |
|
|
|
|
| 3 |
|
|
|
|
| 4 |
|
|
|
|
North Dakota Small Business Employment Statistics
The number of people employed by small businesses in North Dakota, and the number of jobs supported by SBA loans are:
- Number of People in North Dakota Employed by Small Businesses: 198,964
- Number of Jobs Supported by SBA Loans from 2010 to 2018: 17,156
- Percent of Jobs Supported by SBA Loans from 2010 to 2018: 8.6%
- Number of Jobs Supported by SBA Loans in 2018: 1,577
- Percent of Jobs Supported by SBA Loans in 2018: 0.8%
SBA loan funds helped support roughly 9% of the jobs created by small businesses in the state of North Dakota from 2010 to 2018.
Number of People in North Dakota Employed by Small Businesses
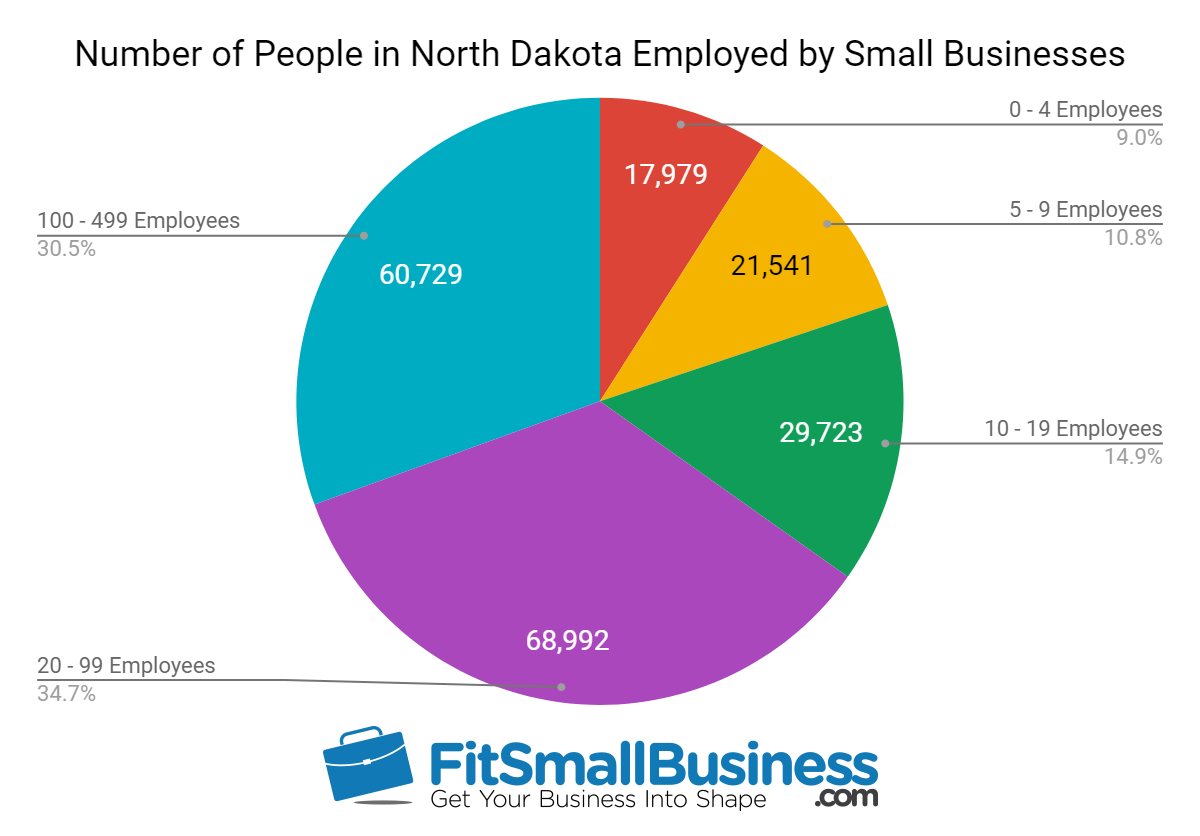
Source: SBA & SUSB Data
North Dakota SBA Franchise Loan Statistics
The SBA loan statistics for franchise financing in North Dakota from 2010 to 2018 are:
- Number of SBA Franchise Loans Made from 2010 to 2018: 93
- Top Franchise Funded by SBA Loans in North Dakota: ServiceMaster
Of the 93 SBA franchise loans made in North Dakota between 2010 and 2018, four loans went to borrowers financing a ServiceMaster franchise.
37. Ohio SBA Statistics and Small Business Industry Statistics
As of 2016, small businesses employed 2,192,920 people in the state of Ohio. Over $665 million in SBA loan funds went to small businesses in Ohio in 2018 alone. The leading industry supported with SBA loan funds between 2010 and 2018 was the construction industry, which received 4,077 loans. However, the construction industry is not one of the top three small business industries in the state. The top franchise financed by SBA loans in Ohio was Subway Sandwich.
The SBA loan statistics and other small business industry statistics we evaluated for Ohio are:
Ohio SBA Loan Statistics
The primary SBA loan statistics for the state of Ohio are:
- Top SBA Lender: The Huntington National Bank
- Number of SBA Loans Approved in 2018: 3,421
- Total Dollar Amount of SBA Loans Approved in 2018: $665,345,883
- Average Interest Rate of SBA Loans Made in 2018: 6.8%
- Average Loan Term for SBA Loans Made in 2018: 10 Years
- Average Default Rate of SBA Loans from 2010 to 2018: 15.3%
In 2018, The Huntington National Bank was one of the top 100 SBA lenders, operating in the Midwest, and was the top SBA lender in Ohio. The Huntington National Bank originated 12,060 loans totaling $266,246,460 in the state of Ohio in fiscal year 2018. This represented 60.2% of the total number of SBA loans made in the state.
Ohio Small Business Industry Statistics
The three NAICS codes for small businesses employing the largest number of people in Ohio, and the number of SBA loans made in those industries are:
| Ranking |
|
|
|
|
|---|---|---|---|---|
| 1 |
|
|
|
|
| 2 |
|
|
|
|
| 3 |
|
|
|
|
| 7 |
|
|
|
|
Ohio Small Business Employment Statistics
The number of people employed by small businesses in Ohio, and the number of jobs supported by SBA loans are:
- Number of People in Ohio Employed by Small Businesses: 2,192,920
- Number of Jobs Supported by SBA Loans from 2010 to 2018: 222,556
- Percent of Jobs Supported by SBA Loans from 2010 to 2018: 10.1%
- Number of Jobs Supported by SBA Loans in 2018: 31,013
- Percent of Jobs Supported by SBA Loans in 2018: 1.4%
SBA loan funds helped support roughly 10% of the jobs created by small businesses in the state of Ohio from 2010 to 2018.
Number of People in Ohio Employed by Small Businesses

Source: SBA & SUSB Data
Ohio SBA Franchise Loan Statistics
The SBA loan statistics for franchise financing in Ohio from 2010 to 2018 are:
- Number of SBA Franchise Loans Made from 2010 to 2018: 1,595
- Top Franchise Funded by SBA Loans in Ohio: Subway Sandwich
Of the 1,595 SBA franchise loans made in Ohio between 2010 and 2018, 94 loans went to borrowers financing a Subway Sandwich franchise. Subway was in the list of the top 50 franchises as determined by SBA loan default rates from 2010 to 2018.
38. Oklahoma SBA Statistics and Small Business Industry Statistics
As of 2016, small businesses employed 712,582 people in the state of Oklahoma. Over $182 million in SBA loan funds went to small businesses in Oklahoma in 2018 alone. The leading industry supported with SBA loan funds between 2010 and 2018 was the accommodation and food service industry, which received 599 loans, and is one of the top three small business industries in the state. The top franchise financed by SBA loans in Oklahoma was Subway Sandwich.
The SBA loan statistics and other small business industry statistics we evaluated for Oklahoma are:
Oklahoma SBA Loan Statistics
The primary SBA loan statistics for the state of Oklahoma are:
- Top SBA Lender: BancFirst
- Number of SBA Loans Approved in 2018: 504
- Total Dollar Amount of SBA Loans Approved in 2018: $182,348,165
- Average Interest Rate of SBA Loans Made in 2018: 6.5%
- Average Loan Term for SBA Loans Made in 2018: 10 Years
- Average Default Rate of SBA Loans from 2010 to 2018: 13.3%
BancFirst is a local bank serving the state of Oklahoma. BancFirst originated 122 loans totaling $29,959,520 in the state of Oklahoma in fiscal year 2018. This represented 24.2% of the total number of SBA loans made in the state.
Oklahoma Small Business Industry Statistics
The three NAICS codes for small businesses employing the largest number of people in Oklahoma, and the number of SBA loans made in those industries are:
| Ranking |
|
|
|
|
|---|---|---|---|---|
| 1 |
|
|
|
|
| 2 |
|
|
|
|
| 3 |
|
|
|
|
Oklahoma Small Business Employment Statistics
The number of people employed by small businesses in Oklahoma, and the number of jobs supported by SBA loans are:
- Number of People in Oklahoma Employed by Small Businesses: 712,582
- Number of Jobs Supported by SBA Loans from 2010 to 2018: 56,301
- Percent of Jobs Supported by SBA Loans from 2010 to 2018: 7.9%
- Number of Jobs Supported by SBA Loans in 2018: 5,398
- Percent of Jobs Supported by SBA Loans in 2018: 0.8%
SBA loan funds helped support roughly 8% of the jobs created by small businesses in the state of Oklahoma from 2010 to 2018.
Number of People in Oklahoma Employed by Small Businesses

Source: SBA & SUSB Data
Oklahoma SBA Franchise Loan Statistics
The SBA loan statistics for franchise financing in Oklahoma from 2010 to 2018 are:
- Number of SBA Franchise Loans Made from 2010 to 2018: 356
- Top Franchise Funded by SBA Loans in Oklahoma: Subway Sandwich
Of the 356 SBA franchise loans made in Oklahoma between 2010 and 2018, 27 loans went to borrowers financing a Subway Sandwich franchise. Subway was in the list of the top 50 franchises as determined by SBA loan default rates from 2010 to 2018.
39. Oregon SBA Statistics and Small Business Industry Statistics
As of 2016, small businesses employed 852,983 people in the state of Oregon. Over $287 million in SBA loan funds went to small businesses in Oregon in 2018 alone. The leading industry supported with SBA loan funds between 2010 and 2018 was the accommodation and food service industry, which received 1,016 loans, and is one of the top three small business industries in the state. The top franchise financed by SBA loans in Oregon was Dutch Brothers Coffee.
The SBA loan statistics and other small business industry statistics we evaluated for Oregon are:
Oregon SBA Loan Statistics
The primary SBA loan statistics for the state of Oregon are:
- Top Lender: Columbia State Bank
- Number of SBA Loans Approved in 2018: 895
- Total Dollar Amount of SBA Loans Approved in 2018: $287,359,815
- Average Interest Rate of SBA Loans Made in 2018: 7.3%
- Average Loan Term for SBA Loans Made in 2018: 12 Years
- Average Default Rate of SBA Loans from 2010 to 2018: 12.1%
Columbia State Bank is a regional bank serving the Northwest United States. Columbia State Bank originated 156 loans totaling $11,282,935 in the state of Oregon in fiscal year 2018. This represented 17.4% of the total number of SBA loans made in the state.
Oregon Small Business Industry Statistics
The three NAICS codes for small businesses employing the largest number of people in Oregon, and the number of SBA loans made in those industries are:
| Ranking |
|
|
|
|
|---|---|---|---|---|
| 1 |
|
|
|
|
| 2 |
|
|
|
|
| 3 |
|
|
|
|
Oregon Small Business Employment Statistics
The number of people employed by small businesses in Oregon, and the number of jobs supported by SBA loans are:
- Number of People in Oregon Employed by Small Businesses: 852,983
- Number of Jobs Supported by SBA Loans from 2010 to 2018: 65,923
- Percent of Jobs Supported by SBA Loans from 2010 to 2018: 7.7%
- Number of Jobs Supported by SBA Loans in 2018: 8,745
- Percent of Jobs Supported by SBA Loans in 2018: 1.0%
SBA loan funds helped support roughly 8% of the jobs created by small businesses in the state of Oregon from 2010 to 2018.
Number of People in Oregon Employed by Small Businesses
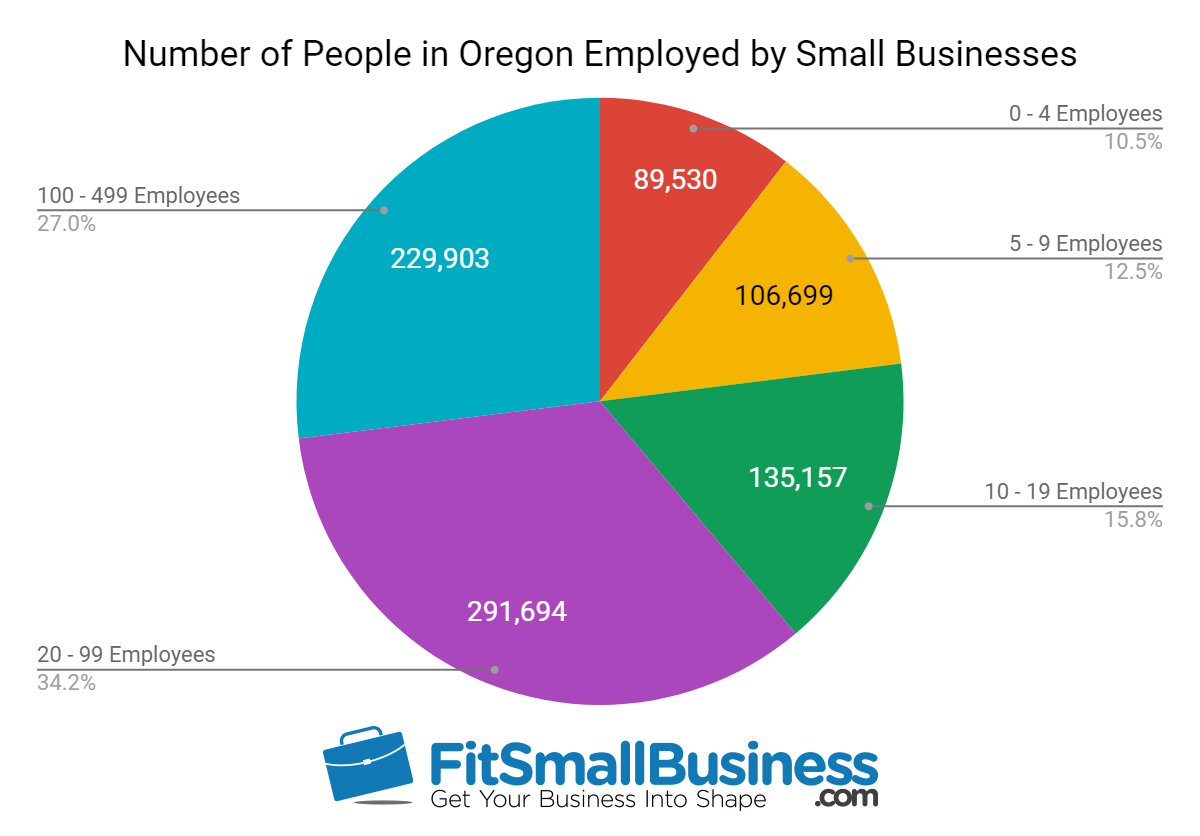
Source: SBA & SUSB Data
Oregon SBA Franchise Loan Statistics
The SBA loan statistics for franchise financing in Oregon from 2010 to 2018 are:
- Number of SBA Franchise Loans Made from 2010 to 2018: 352
- Top Franchise Funded by SBA Loans in Oregon: Dutch Brothers Coffee
Of the 352 SBA franchise loans made in Oregon between 2010 and 2018, 11 loans went to borrowers financing a Dutch Brothers Coffee franchise.
40. Pennsylvania SBA Statistics and Small Business Industry Statistics
As of 2016, small businesses employed 2,497,524 people in the state of Pennsylvania. Nearly $600 million in SBA loan funds went to small businesses in Pennsylvania in 2018 alone. The leading industry supported with SBA loan funds between 2010 and 2018 was the accommodation and food service industry, which received 2,391 loans, and is one of the top three small business industries in the state. The top franchise financed by SBA loans in Pennsylvania was Subway Sandwich.
The SBA loan statistics and other small business industry statistics we evaluated for Pennsylvania are:
Pennsylvania SBA Loan Statistics
The primary SBA loan statistics for the state of Pennsylvania are:
- Top SBA Lender: TD Bank
- Number of SBA Loans Approved in 2018: 2,111
- Total Dollar Amount of SBA Loans Approved in 2018: $599,830,547
- Average Interest Rate of SBA Loans Made in 2018: 7.5%
- Average Loan Term for SBA Loans Made in 2018: 11 Years
- Average Default Rate of SBA Loans from 2010 to 2018: 14.2%
Pennsylvania’s top SBA lender in 2018 was TD Bank, a regional bank serving the East Coast. Additionally, TD Bank was among the top 100 SBA lenders for 2018. TD Bank originated 319 loans totaling $12,172,200 in the state of Pennsylvania in fiscal year 2018. This represented 15.1% of the total number of SBA loans made in the state.
Pennsylvania Small Business Industry Statistics
The three NAICS codes for small businesses employing the largest number of people in Pennsylvania, and the number of SBA loans made in those industries are:
| Ranking |
|
|
|
|
|---|---|---|---|---|
| 1 |
|
|
|
|
| 2 |
|
|
|
|
| 3 |
|
|
|
|
Pennsylvania Small Business Employment Statistics
The number of people employed by small businesses in Pennsylvania, and the number of jobs supported by SBA loans are:
- Number of People in Pennsylvania Employed by Small Businesses: 2,497,524
- Number of Jobs Supported by SBA Loans from 2010 to 2018: 162,930
- Percent of Jobs Supported by SBA Loans from 2010 to 2018: 6.5%
- Number of Jobs Supported by SBA Loans in 2018: 20,922
- Percent of Jobs Supported by SBA Loans in 2018: 0.8%
SBA loan funds helped support more than 6% of the jobs created by small businesses in the state of Pennsylvania from 2010 to 2018.
Number of People in Pennsylvania Employed by Small Businesses

Source: SBA & SUSB Data
Pennsylvania SBA Franchise Loan Statistics
The SBA loan statistics for franchise financing in Pennsylvania from 2010 to 2018 are:
- Number of SBA Franchise Loans Made from 2010 to 2018: 1,137
- Top Franchise Funded by SBA Loans in Pennsylvania: Subway Sandwich
Of the 1,137 SBA franchise loans made in Pennsylvania between 2010 and 2018, 57 loans went to borrowers financing a Subway Sandwich franchise. Subway was in the list of the top 50 franchises as determined by SBA loan default rates from 2010 to 2018.
41. Puerto Rico SBA Statistics and Small Business Industry Statistics
As of 2016, small businesses employed 539,380 people in Puerto Rico. Nearly $34 million in SBA loan funds went to small businesses in Puerto Rico in 2018 alone. The leading industry supported with SBA loan funds between 2010 and 2018 was the retail trade industry, which received 794 loans, and is one of the top three small business industries in the state. The top franchise financed by SBA loans in Puerto Rico was Yogen Fruz.
The SBA loan statistics and other small business industry statistics we evaluated for Puerto Rico are:
Puerto Rico SBA Loan Statistics
The primary SBA loan statistics for Puerto Rico are:
- Top SBA Lender: Banco Popular de Puerto Rico
- Number of SBA Loans Approved in 2018: 285
- Total Dollar Amount of SBA Loans Approved in 2018: $33,567,380
- Average Interest Rate of SBA Loans Made in 2018: 8.8%
- Average Loan Term for SBA Loans Made in 2018: 8 Years
- Average Default Rate of SBA Loans from 2010 to 2018: 21.1%
Banco Popular de Puerto Rico is a regional bank primarily serving Puerto Rico and the Virgin Islands. Banco Popular de Puerto Rico originated 176 loans totaling $20,136,715 in Puerto Rico in fiscal year 2018. This represented 61.8% of the total number of SBA loans made in Puerto Rico.
Puerto Rico Small Business Industry Statistics
The three NAICS codes for small businesses employing the largest number of people in Puerto Rico, and the number of SBA loans made in those industries are:
| Ranking |
|
|
|
|
|---|---|---|---|---|
| 1 | 62 - Health Care and
|
|
|
|
| 2 |
|
|
|
|
| 3 |
|
|
|
|
| 5 |
|
|
|
|
Puerto Rico Small Business Employment Statistics
The number of people employed by small businesses in Puerto Rico, and the number of jobs supported by SBA loans are:
- Number of People in Puerto Rico Employed by Small Businesses: 539,380
- Number of Jobs Supported by SBA Loans from 2010 to 2018: 40,755
- Percent of Jobs Supported by SBA Loans from 2010 to 2018: 7.6%
- Number of Jobs Supported by SBA Loans in 2018: 2,889
- Percent of Jobs Supported by SBA Loans in 2018: 0.5%
SBA loan funds helped support nearly 8% of the jobs created by small businesses in Puerto Rico from 2010 to 2018.
Number of People in Puerto Rico Employed by Small Businesses
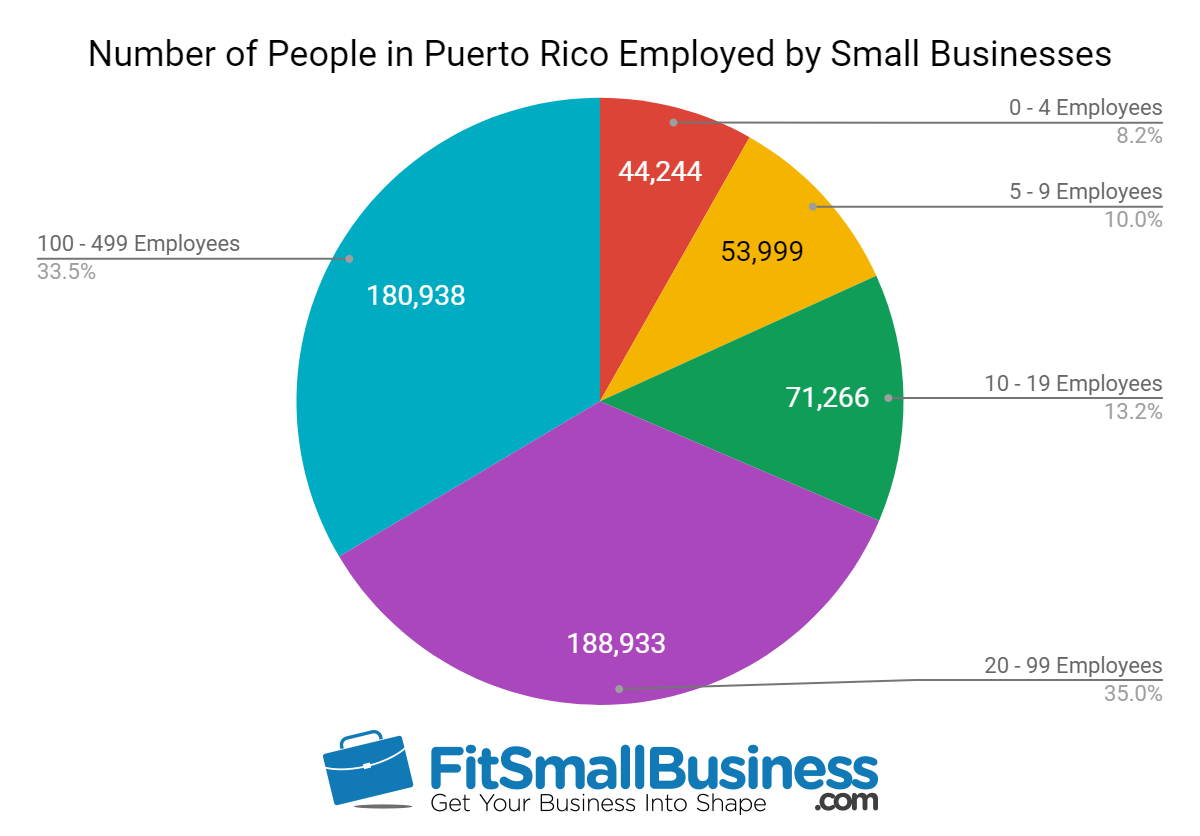
Source: SBA & SUSB Data
Puerto Rico SBA Franchise Loan Statistics
The SBA loan statistics for franchise financing in Puerto Rico from 2010 to 2018 are:
- Number of SBA Franchise Loans Made from 2010 to 2018: 102
- Top Franchise Funded by SBA Loans in Puerto Rico: Yogen Fruz
Of the 102 SBA franchise loans made in Puerto Rico between 2010 and 2018, 16 loans went to borrowers financing a Yogen Fruz franchise.
42. Rhode Island SBA Statistics and Small Business Industry Statistics
As of 2016, small businesses employed 229,974 people in the state of Rhode Island. Over $41 million in SBA loan funds went to small businesses in Rhode Island in 2018 alone. The leading industry supported with SBA loan funds between 2010 and 2018 was the construction industry, which received 378 loans. However, the construction industry is not one of the top three small business industries in the state. The top franchise financed by SBA loans in Rhode Island was Subway Sandwich.
The SBA loan statistics and other small business industry statistics we evaluated for Rhode Island are:
Rhode Island SBA Loan Statistics
The primary SBA loan statistics for the state of Rhode Island are:
- Top SBA Lender: Independence Bank
- Number of SBA Loans Approved in 2018: 339
- Total Dollar Amount of SBA Loans Approved in 2018: $41,050,160
- Average Interest Rate of SBA Loans Made in 2018: 7.1%
- Average Loan Term for SBA Loans Made in 2018: 9 Years
- Average Default Rate of SBA Loans from 2010 to 2018: 14.9%
Independence Bank is one of the top 100 SBA lenders, with national operations. In fiscal year 2018, Independence Bank originated 50 loans totaling $3,548,750 in the state of Rhode Island. This represented 14.7% of the total number of SBA loans made in the state.
Rhode Island Small Business Industry Statistics
The three NAICS codes for small businesses employing the largest number of people in Rhode Island, and the number of SBA loans made in those industries are:
| Ranking |
|
|
|
|
|---|---|---|---|---|
| 1 |
|
|
|
|
| 2 |
|
|
|
|
| 3 |
|
|
|
|
| 5 |
|
|
|
|
Rhode Island Small Business Employment Statistics
The number of people employed by small businesses in Rhode Island, and the number of jobs supported by SBA loans are:
- Number of People in Rhode Island Employed by Small Businesses: 229,974
- Number of Jobs Supported by SBA Loans from 2010 to 2018: 29,160
- Percent of Jobs Supported by SBA Loans from 2010 to 2018: 12.7%
- Number of Jobs Supported by SBA Loans in 2018: 2,375
- Percent of Jobs Supported by SBA Loans in 2018: 1.0%
SBA loan funds helped support nearly 13% of the jobs created by small businesses in the state of Rhode Island from 2010 to 2018.
Number of People in Rhode Island Employed by Small Businesses

Source: SBA & SUSB Data
Rhode Island SBA Franchise Loan Statistics
The SBA loan statistics for franchise financing in Rhode Island from 2010 to 2018 are:
- Number of SBA Franchise Loans Made from 2010 to 2018: 101
- Top Franchise Funded by SBA Loans in Rhode Island: Subway Sandwich
Of the 101 SBA franchise loans made in Rhode Island between 2010 and 2018, 14 loans went to borrowers financing a Subway Sandwich franchise. Subway was in the list of the top 50 franchises as determined by SBA loan default rates from 2010 to 2018.
43. South Carolina SBA Statistics and Small Business Industry Statistics
As of 2016, small businesses employed 794,711 people in the state of South Carolina. Over $233 million in SBA loan funds went to small businesses in South Carolina in 2018 alone. The leading industry supported with SBA loan funds between 2010 and 2018 was the accommodation and food service industry, which received 647 loans, and is one of the top three small business industries in the state. The top franchise financed by SBA loans in South Carolina was Quality Inn & Suites.
The SBA loan statistics and other small business industry statistics we evaluated for South Carolina are:
South Carolina SBA Loan Statistics
The primary SBA loan statistics for the state of South Carolina are:
- Top SBA Lender: TD Bank
- Number of SBA Loans Approved in 2018: 579
- Total Dollar Amount of SBA Loans Approved in 2018: $233,238,625
- Average Interest Rate of SBA Loans Made in 2018: 7.7%
- Average Loan Term for SBA Loans Made in 2018: 12 Years
- Average Default Rate of SBA Loans from 2010 to 2018: 12.6%
TD Bank, a regional bank serving the East Coast, was the top SBA lender in South Carolina in 2018, as well as being one of the top 100 SBA lenders nationally. TD Bank originated 148 loans totaling $10,516,025 in the state of South Carolina in fiscal year 2018. This represented 25.6% of the total number of SBA loans made in the state.
South Carolina Small Business Industry Statistics
The three NAICS codes for small businesses employing the largest number of people in South Carolina, and the number of SBA loans made in those industries are:
| Ranking |
|
|
|
|
|---|---|---|---|---|
| 1 |
|
|
|
|
| 2 |
|
|
|
|
| 3 |
|
|
|
|
South Carolina Small Business Employment Statistics
The number of people employed by small businesses in South Carolina, and the number of jobs supported by SBA loans are:
- Number of People in South Carolina Employed by Small Businesses: 794,711
- Number of Jobs Supported by SBA Loans from 2010 to 2018: 41,284
- Percent of Jobs Supported by SBA Loans from 2010 to 2018: 5.2%
- Number of Jobs Supported by SBA Loans in 2018: 5,770
- Percent of Jobs Supported by SBA Loans in 2018: 0.7%
SBA loan funds helped support roughly 5% of the jobs created by small businesses in the state of South Carolina from 2010 to 2018.
Number of People in South Carolina Employed by Small Businesses
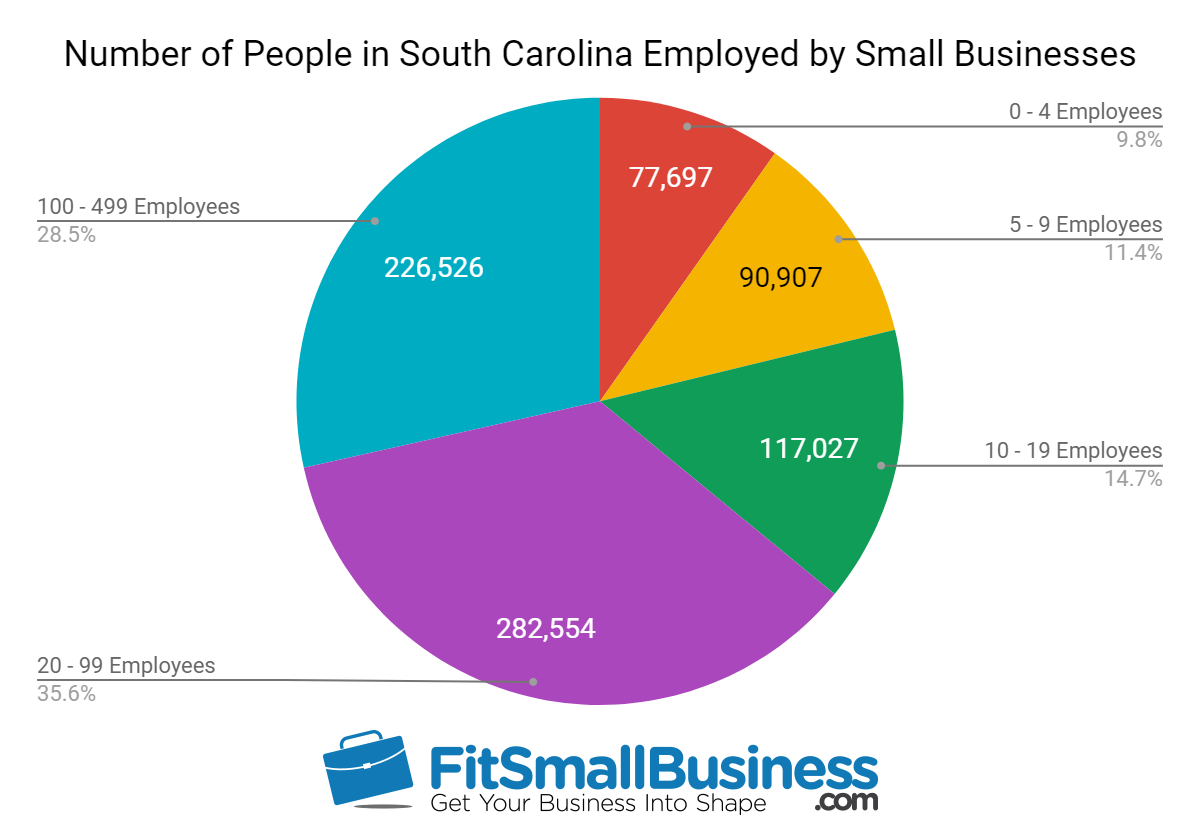
Source: SBA & SUSB Data
South Carolina SBA Franchise Loan Statistics
The SBA loan statistics for franchise financing in South Carolina from 2010 to 2018 are:
- Number of SBA Franchise Loans Made from 2010 to 2018: 495
- Top Franchise Funded by SBA Loans in South Carolina: Quality Inn & Suites
Of the 495 SBA franchise loans made in South Carolina between 2010 and 2018, 19 loans went to borrowers financing a Quality Inn & Suites franchise. Quality Inn & Suites was not in the list of the top 50 or bottom 50 franchises as determined by SBA loan default rates from 2010 to 2018.
44. South Dakota SBA Statistics and Small Business Industry Statistics
As of 2016, small businesses employed 210,534 people in the state of South Dakota. Nearly $33 million in SBA loan funds went to small businesses in South Dakota in 2018 alone. The leading industry supported with SBA loan funds between 2010 and 2018 was the construction industry, which received 177 loans. However, the construction industry is not one of the top three small business industries in the state. The top franchise financed by SBA loans in South Dakota was Marco’s Pizza.
The SBA loan statistics and other small business industry statistics we evaluated for South Dakota are:
South Dakota SBA Loan Statistics
The primary SBA loan statistics for the state of South Dakota are:
- Top SBA Lender: Wells Fargo
- Number of SBA Loans Approved in 2018: 121
- Total Dollar Amount of SBA Loans Approved in 2018: $32,873,813
- Average Interest Rate of SBA Loans Made in 2018: 6.7%
- Average Loan Term for SBA Loans Made in 2018: 10 Years
- Average Default Rate of SBA Loans from 2010 to 2018: 13.1%
Wells Fargo is a national lender, carrying the title of top SBA lender in the nationally for 2018. This title is carried forward to South Dakota, where the company also originated the most SBA loans. Wells Fargo originated 24 loans totaling $5,897,295 in the state of South Dakota in fiscal year 2018. This represented 19.8% of the total number of SBA loans made in the state.
South Dakota Small Business Industry Statistics
The three NAICS codes for small businesses employing the largest number of people in South Dakota, and the number of SBA loans made in those industries are:
| Ranking |
|
|
|
|
|---|---|---|---|---|
| 1 |
|
|
|
|
| 2 |
|
|
|
|
| 3 |
|
|
|
|
| 4 |
|
|
|
|
South Dakota Small Business Employment Statistics
The number of people employed by small businesses in South Dakota, and the number of jobs supported by SBA loans are:
- Number of People in South Dakota Employed by Small Businesses: 210,534
- Number of Jobs Supported by SBA Loans from 2010 to 2018: 12,795
- Percent of Jobs Supported by SBA Loans from 2010 to 2018: 6.0%
- Number of Jobs Supported by SBA Loans in 2018: 1,312
- Percent of Jobs Supported by SBA Loans in 2018: 0.6%
SBA loan funds helped support roughly 6% of the jobs created by small businesses in the state of South Dakota from 2010 to 2018.
Number of People in South Dakota Employed by Small Businesses
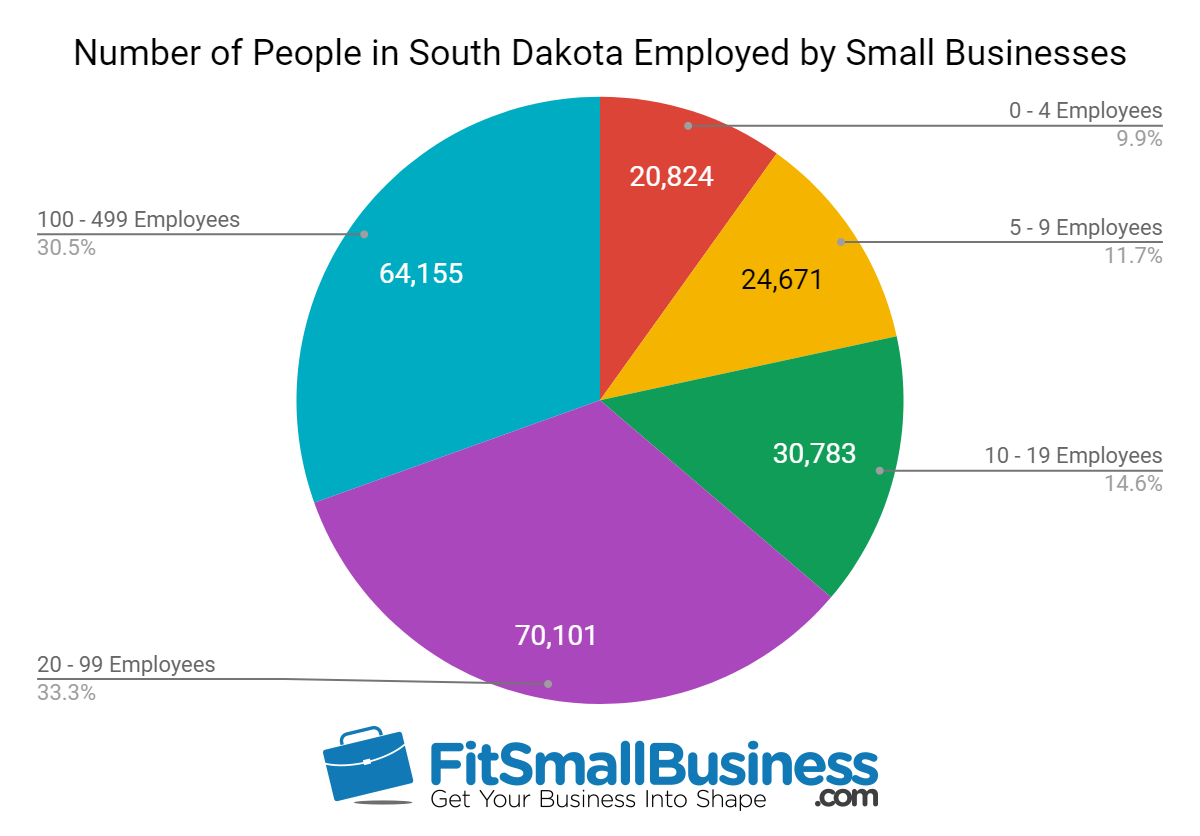
Source: SBA & SUSB Data
South Dakota SBA Franchise Loan Statistics
The SBA loan statistics for franchise financing in South Dakota from 2010 to 2018 are:
- Number of SBA Franchise Loans Made from 2010 to 2018: 93
- Top Franchise Funded by SBA Loans in South Dakota: Marco’s Pizza
Of the 93 SBA franchise loans made in South Dakota between 2010 and 2018, six loans went to borrowers financing a Marco’s Pizza franchise.
45. Tennessee SBA Statistics and Small Business Industry Statistics
As of 2016, small businesses employed 1,096,245 people in the state of Tennessee. Over $220 million in SBA loan funds went to small businesses in Tennessee in 2018 alone. The leading industry supported with SBA loan funds between 2010 and 2018 was the accommodation and food service industry, which received 600 loans, and is one of the top three small business industries in the state. The top franchise financed by SBA loans in Tennessee was Sport Clips.
The SBA loan statistics and other small business industry statistics we evaluated for Tennessee are:
Tennessee SBA Loan Statistics
The primary SBA loan statistics for the state of Tennessee are:
- Top SBA Lender: U.S. Bank
- Number of SBA Loans Approved in 2018: 545
- Total Dollar Amount of SBA Loans Approved in 2018: $220,171,918
- Average Interest Rate of SBA Loans Made in 2018: 7.1%
- Average Loan Term for SBA Loans Made in 2018: 12 Years
- Average Default Rate of SBA Loans from 2010 to 2018: 13.4%
U.S. Bank, one of the top 100 SBA lenders nationally, was the leading SBA lender in Tennessee in 2018. During the 2018 fiscal year, U.S. Bank originated 89 loans totaling $6,213,800 in the state of Tennessee. This represented 16.3% of the total number of SBA loans made in the state.
Tennessee Small Business Industry Statistics
The three NAICS codes for small businesses employing the largest number of people in Tennessee, and the number of SBA loans made in those industries are:
| Ranking |
|
|
|
|
|---|---|---|---|---|
| 1 |
|
|
|
|
| 2 |
|
|
|
|
| 3 |
|
|
|
|
Tennessee Small Business Employment Statistics
The number of people employed by small businesses in Tennessee, and the number of jobs supported by SBA loans are:
- Number of People in Tennessee Employed by Small Businesses: 1,096,245
- Number of Jobs Supported by SBA Loans from 2010 to 2018: 54,637
- Percent of Jobs Supported by SBA Loans from 2010 to 2018: 4.9%
- Number of Jobs Supported by SBA Loans in 2018: 6,164
- Percent of Jobs Supported by SBA Loans in 2018: 0.6%
SBA loan funds helped support roughly 5% of the jobs created by small businesses in the state of Tennessee from 2010 to 2018.
Number of People in Tennessee Employed by Small Businesses
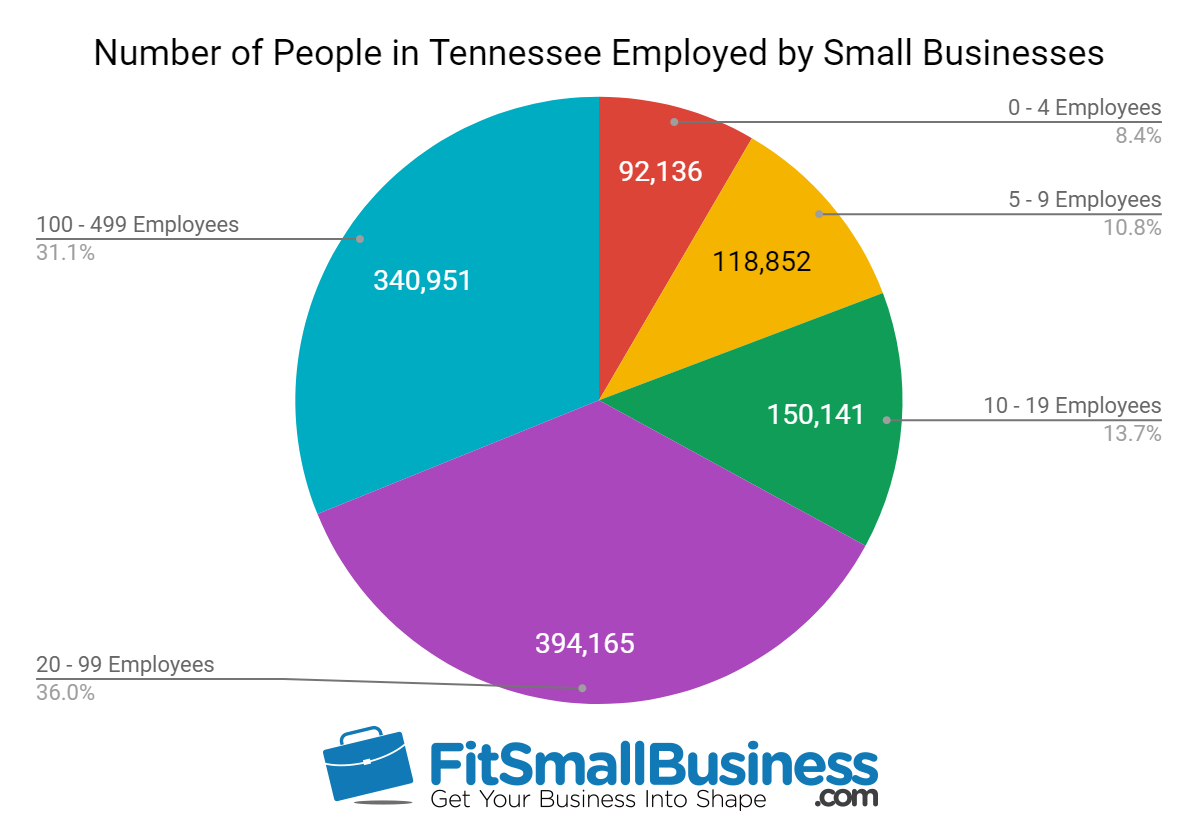
Source: SBA & SUSB Data
Tennessee SBA Franchise Loan Statistics
The SBA loan statistics for franchise financing in Tennessee from 2010 to 2018 are:
- Number of SBA Franchise Loans Made from 2010 to 2018: 498
- Top Franchise Funded by SBA Loans in Tennessee: Sport Clips
Of the 498 SBA franchise loans made in Tennessee between 2010 and 2018, 20 loans went to borrowers financing a Sport Clips franchise.
46. Texas SBA Statistics and Small Business Industry Statistics
As of 2016, small businesses employed 4,706,864 people in the state of Texas. Over $2 billion in SBA loan funds went to small businesses in Texas in 2018 alone. The leading industry supported with SBA loan funds between 2010 and 2018 was the accommodation and food service industry, which received 5,121 loans, and is one of the top three small business industries in the state. The top franchise financed by SBA loans in Texas was Subway Sandwich.
The SBA loan statistics and other small business industry statistics we evaluated for Texas are:
Texas SBA Loan Statistics
The primary SBA loan statistics for the state of Texas are:
- Top SBA Lender: Wells Fargo
- Number of SBA Loans Approved in 2018: 4,452
- Total Dollar Amount of SBA Loans Approved in 2018: $2,036,128,741
- Average Interest Rate of SBA Loans Made in 2018: 7.3%
- Average Loan Term for SBA Loans Made in 2018: 12 Years
- Average Default Rate of SBA Loans from 2010 to 2018: 13.7%
During the year 2018, Wells Fargo originated the most SBA loans in Texas. The top SBA lender title is also carried by Wells Fargo nationally, and so this is not unexpected. Wells Fargo originated 517 loans totaling $92,364,460 in the state of Texas in fiscal year 2018. This represented 11.6% of the total number of SBA loans made in the state.
Texas Small Business Industry Statistics
The three NAICS codes for small businesses employing the largest number of people in Texas, and the number of SBA loans made in those industries are:
| Ranking |
|
|
|
|
|---|---|---|---|---|
| 1 |
|
|
|
|
| 2 |
|
|
|
|
| 3 |
|
|
|
|
Texas Small Business Employment Statistics
The number of people employed by small businesses in Texas, and the number of jobs supported by SBA loans are:
- Number of People in Texas Employed by Small Businesses: 4,706,864
- Number of Jobs Supported by SBA Loans from 2010 to 2018: 446,676
- Percent of Jobs Supported by SBA Loans from 2010 to 2018: 9.5%
- Number of Jobs Supported by SBA Loans in 2018: 46,777
- Percent of Jobs Supported by SBA Loans in 2018: 1.0%
SBA loan funds helped support nearly 10% of the jobs created by small businesses in the state of Texas from 2010 to 2018.
Number of People in Texas Employed by Small Businesses

Source: SBA & SUSB Data
Texas SBA Franchise Loan Statistics
The SBA loan statistics for franchise financing in Texas from 2010 to 2018 are:
- Number of SBA Franchise Loans Made from 2010 to 2018: 3,884
- Top Franchise Funded by SBA Loans in Texas: Subway Sandwich
Of the 3,884 SBA franchise loans made in Texas between 2010 and 2018, 81 loans went to borrowers financing a Subway Sandwich franchise. Subway was in the list of the top 50 franchises as determined by SBA loan default rates from 2010 to 2018.
47. Utah SBA Statistics and Small Business Industry Statistics
As of 2016, small businesses employed 572,888 people in the state of Utah. Nearly $315 million in SBA loan funds went to small businesses in Utah in 2018 alone. The leading industry supported with SBA loan funds between 2010 and 2018 was the construction industry, which received 1,176 loans, and is one of the top three small business industries in the state. The top franchise financed by SBA loans in Utah was BeeHive Homes.
The SBA loan statistics and other small business industry statistics we evaluated for Utah are:
Utah SBA Loan Statistics
The primary SBA loan statistics for the state of Utah are:
- Top SBA Lender: Zions Bank
- Number of SBA Loans Approved in 2018: 997
- Total Dollar Amount of SBA Loans Approved in 2018: $314,844,222
- Average Interest Rate of SBA Loans Made in 2018: 7.5%
- Average Loan Term for SBA Loans Made in 2018: 11 Years
- Average Default Rate of SBA Loans from 2010 to 2018: 13.2%
Zions Bank, the top SBA lender in Utah, is also one of the top 100 SBA lenders nationally, with operations in the western part of the country. During fiscal year 2018, Zions Bank originated 207 loans totaling $28,287,680 in the state of Utah. This represented 20.8% of the total number of SBA loans made in the state.
Utah Small Business Industry Statistics
The three NAICS codes for small businesses employing the largest number of people in Utah, and the number of SBA loans made in those industries are:
| Ranking |
|
|
|
|
|---|---|---|---|---|
| 1 | 72 - Accommodation
|
|
|
|
| 2 |
|
|
|
|
| 3 |
|
|
|
|
Utah Small Business Employment Statistics
The number of people employed by small businesses in Utah, and the number of jobs supported by SBA loans are:
- Number of People in Utah Employed by Small Businesses: 572,888
- Number of Jobs Supported by SBA Loans from 2010 to 2018: 120,339
- Percent of Jobs Supported by SBA Loans from 2010 to 2018: 21%
- Number of Jobs Supported by SBA Loans in 2018: 12,075
- Percent of Jobs Supported by SBA Loans in 2018: 2.1%
SBA loan funds helped support roughly 21% of the jobs created by small businesses in the state of Utah from 2010 to 2018.
Number of People in Utah Employed by Small Businesses

Source: SBA & SUSB Data
Utah SBA Franchise Loan Statistics
The SBA loan statistics for franchise financing in Utah from 2010 to 2018 are:
- Number of SBA Franchise Loans Made from 2010 to 2018: 506
- Top Franchise Funded by SBA Loans in Utah: BeeHive Homes
Of the 506 SBA franchise loans made in Utah between 2010 and 2018, 27 loans went to borrowers financing a BeeHive Homes franchise.
48. Vermont SBA Statistics and Small Business Industry Statistics
As of 2016, small businesses employed 161,080 people in the state of Vermont. Nearly $26 million in SBA loan funds went to small businesses in Vermont in 2018 alone. The leading industry supported with SBA loan funds between 2010 and 2018 was the accommodation and food service industry, which received 274 loans, and is one of the top three small business industries in the state. The top franchise financed by SBA loans in Vermont was Snap Fitness.
The SBA loan statistics and other small business industry statistics we evaluated for Vermont are:
Vermont SBA Loan Statistics
The primary SBA loan statistics for the state of Vermont are:
- Top SBA Lender: Community National Bank
- Number of SBA Loans Approved in 2018: 210
- Total Dollar Amount of SBA Loans Approved in 2018: $25,921,687
- Average Interest Rate of SBA Loans Made in 2018: 6.6%
- Average Loan Term for SBA Loans Made in 2018: 9 Years
- Average Default Rate of SBA Loans from 2010 to 2018: 12.1%
Community National Bank is a local bank serving Vermont. Community National Bank originated 35 loans totaling $3,623,725 in the state of Vermont in fiscal year 2018. This represented 16.7% of the total number of SBA loans made in the state.
Vermont Small Business Industry Statistics
The three NAICS codes for small businesses employing the largest number of people in Vermont, and the number of SBA loans made in those industries are:
| Ranking |
|
|
|
|
|---|---|---|---|---|
| 1 |
|
|
|
|
| 2 |
|
|
|
|
| 3 |
|
|
|
|
Vermont Small Business Employment Statistics
The number of people employed by small businesses in Vermont, and the number of jobs supported by SBA loans are:
- Number of People in Vermont Employed by Small Businesses: 161,080
- Number of Jobs Supported by SBA Loans from 2010 to 2018: 19,410
- Percent of Jobs Supported by SBA Loans from 2010 to 2018: 12%
- Number of Jobs Supported by SBA Loans in 2018: 1,329
- Percent of Jobs Supported by SBA Loans in 2018: 0.8%
SBA loan funds helped support roughly 12% of the jobs created by small businesses in the state of Vermont from 2010 to 2018.
Number of People in Vermont Employed by Small Businesses
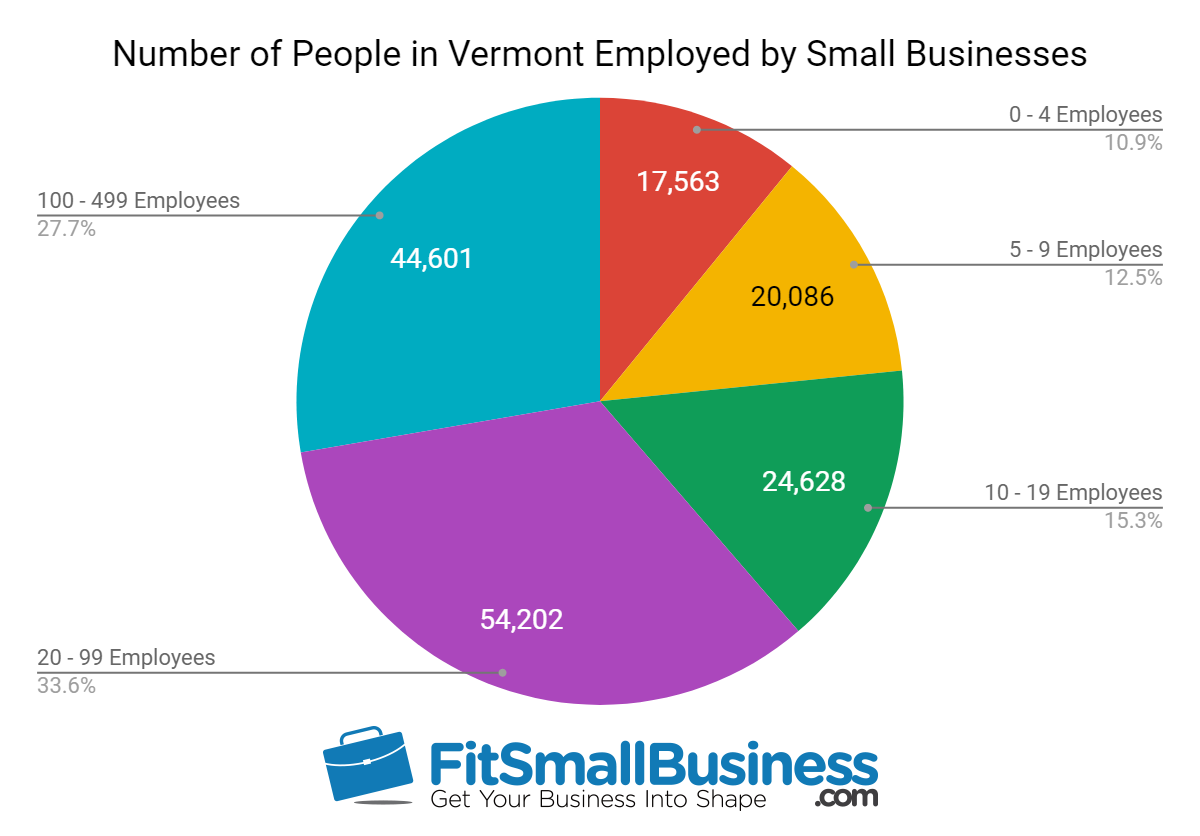
Source: SBA & SUSB Data
Vermont SBA Franchise Loan Statistics
The SBA loan statistics for franchise financing in Vermont from 2010 to 2018 are:
- Number of SBA Franchise Loans Made from 2010 to 2018: 41
- Top Franchise Funded by SBA Loans in Vermont: Snap Fitness
Of the 41 SBA franchise loans made in Vermont between 2010 and 2018, five loans went to borrowers financing a Snap Fitness franchise.
49. Virgin Islands SBA Statistics and Small Business Industry Statistics
As of 2016, small businesses employed 27,738 people in the Virgin Islands. Over $1.9 million in SBA loan funds went to small businesses in Virgin Islands in 2018 alone. The leading industry supported with SBA loan funds between 2010 and 2018 was the retail trade industry, which received 15 loans, and is one of the top three small business industries in the Virgin Islands. The top franchise financed by SBA loans in the Virgin Islands was The Medicine Shoppe.
The SBA loan statistics and other small business industry statistics we evaluated for the Virgin Islands are:
Virgin Islands SBA Loan Statistics
The primary SBA loan statistics for the Virgin Islands are:
- Top SBA Lender: Banco Popular de Puerto Rico
- Number of SBA Loans Approved in 2018: 5
- Total Dollar Amount of SBA Loans Approved in 2018: $1,908,800
- Average Interest Rate of SBA Loans Made in 2018: 7.3%
- Average Loan Term for SBA Loans Made in 2018: 10 Years
- Average Default Rate of SBA Loans from 2010 to 2018: 23.7%
Banco Popular de Puerto Rico is a regional bank primarily serving Puerto Rico and the Virgin Islands. In 2018, Banco Popular de Puerto Rico originated three loans totaling $308,800 in the Virgin Islands. This represented 60% of the total number of SBA loans made in the Virgin Islands.
Virgin Islands Small Business Industry Statistics
The three NAICS codes for small businesses employing the largest number of people in the Virgin Islands, and the number of SBA loans made in those industries are:
| Ranking |
|
|
|
|
|---|---|---|---|---|
| 1 |
|
|
|
|
| 2 |
|
|
|
|
| 3 |
|
|
|
|
Virgin Islands Small Business Employment Statistics
The number of people employed by small businesses in the Virgin Islands, and the number of jobs supported by SBA loans are:
- Number of People in Virgin Islands Employed by Small Businesses: 27,738
- Number of Jobs Supported by SBA Loans from 2010 to 2018: 1,124
- Percent of Jobs Supported by SBA Loans from 2010 to 2018: 4.1%
- Number of Jobs Supported by SBA Loans in 2018: 99
- Percent of Jobs Supported by SBA Loans in 2018: 0.4%
SBA loan funds helped support more than 4% of the jobs created by small businesses in the Virgin Islands from 2010 to 2018.
Number of People in the Virgin Islands Employed by Small Businesses
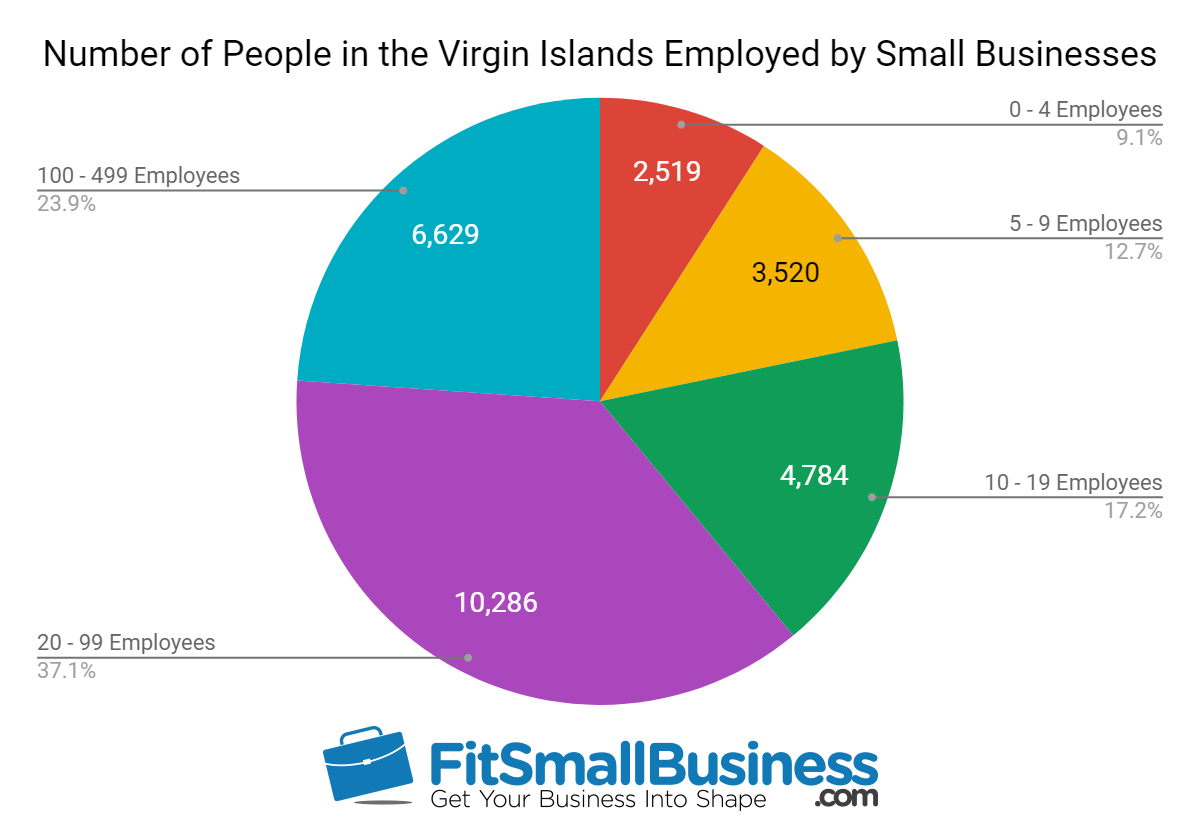
Source: SUSB Data
Virgin Islands SBA Franchise Loan Statistics
The SBA loan statistics for franchise financing in the Virgin Islands from 2010 to 2018 are:
- Number of SBA Franchise Loans Made from 2010 to 2018: 1
- Top Franchise Funded by SBA Loans in Virgin Islands: The Medicine Shoppe
The one SBA franchise loans made in the Virgin Islands between 2010 and 2018 went to finance The Medicine Shoppe franchise.
50. Virginia SBA Statistics and Small Business Industry Statistics
As of 2016, small businesses employed 1,535,136 people in the state of Virginia. Over $336 million in SBA loan funds went to small businesses in Virginia in 2018 alone. The leading industry supported with SBA loan funds between 2010 and 2018 was the professional, scientific, and technical services industry, which received 1,285 loans, and is one of the top three small business industries in the state. The top franchise financed by SBA loans in Virginia was Jimmy John’s.
The SBA loan statistics and other small business industry statistics we evaluated for Virginia are:
Virginia SBA Loan Statistics
The primary SBA loan statistics for the state of Virginia are:
- Top SBA Lender: Wells Fargo
- Number of SBA Loans Approved in 2018: 1,034
- Total Dollar Amount of SBA Loans Approved in 2018: $336,015,470
- Average Interest Rate of SBA Loans Made in 2018: 7.5%
- Average Loan Term for SBA Loans Made in 2018: 10 Years
- Average Default Rate of SBA Loans from 2010 to 2018: 14.2%
For 2018, Wells Fargo originated the most SBA loans in Virginia. As Wells Fargo is also the top SBA lender nationally, it is not surprising that it would also carry this same title in many individual states. Wells Fargo originated 116 loans totaling $22,447,775 in the state of Virginia in fiscal year 2018. This represented 11.2% of the total number of SBA loans made in the state.
Virginia Small Business Industry Statistics
The three NAICS codes for small businesses employing the largest number of people in Virginia, and the number of SBA loans made in those industries are:
| Ranking |
|
|
|
|
|---|---|---|---|---|
| 1 |
|
|
|
|
| 2 |
|
|
|
|
| 3 |
|
|
|
|
Virginia Small Business Employment Statistics
The number of people employed by small businesses in Virginia, and the number of jobs supported by SBA loans are:
- Number of People in Virginia Employed by Small Businesses: 1,535,136
- Number of Jobs Supported by SBA Loans from 2010 to 2018: 87,664
- Percent of Jobs Supported by SBA Loans from 2010 to 2018: 5.7%
- Number of Jobs Supported by SBA Loans in 2018: 12,353
- Percent of Jobs Supported by SBA Loans in 2018: 0.8%
SBA loan funds helped support more than 5% of the jobs created by small businesses in the state of Virginia from 2010 to 2018.
Number of People in Virginia Employed by Small Businesses

Source: SBA & SUSB Data
Virginia SBA Franchise Loan Statistics
The SBA loan statistics for franchise financing in Virginia from 2010 to 2018 are:
- Number of SBA Franchise Loans Made from 2010 to 2018: 802
- Top Franchise Funded by SBA Loans in Virginia: Jimmy John’s
Of the 802 SBA franchise loans made in Virginia between 2010 and 2018, 24 loans went to borrowers financing a Jimmy John’s franchise. Jimmy John’s was in the list of the top 50 franchises as determined by SBA loan default rates from 2010 to 2018.
51. Washington SBA Statistics and Small Business Industry Statistics
As of 2016, small businesses employed 1,379,558 people in the state of Washington. Nearly $583 million in SBA loan funds went to small businesses in Washington in 2018 alone. The leading industry supported with SBA loan funds between 2010 and 2018 was the accommodation and food service industry, which received 2,189 loans, and is one of the top three small business industries in the state. The top franchise financed by SBA loans in Washington was Subway Sandwich.
The SBA loan statistics and other small business industry statistics we evaluated for Washington are:
Washington SBA Loan Statistics
The primary SBA loan statistics for the state of Washington are:
- Top SBA Lender: U.S. Bank
- Number of SBA Loans Approved in 2018: 1,575
- Total Dollar Amount of SBA Loans Approved in 2018: $582,964,633
- Average Interest Rate of SBA Loans Made in 2018: 7.0%
- Average Loan Term for SBA Loans Made in 2018: 12 Years
- Average Default Rate of SBA Loans from 2010 to 2018: 13.3%
U.S. Bank is one of the top 100 SBA lenders, with national operations, as well as the top SBA lender in Washington in 2018. During fiscal year 2018, U.S. Bank originated 184 loans totaling $29,530,810 in the state of Washington. This represented 11.7% of the total number of SBA loans made in the state.
Washington Small Business Industry Statistics
The three NAICS codes for small businesses employing the largest number of people in Washington, and the number of SBA loans made in those industries are:
| Ranking |
|
|
|
|
|---|---|---|---|---|
| 1 |
|
|
|
|
| 2 |
|
|
|
|
| 3 |
|
|
|
|
Washington Small Business Employment Statistics
The number of people employed by small businesses in Washington, and the number of jobs supported by SBA loans are:
- Number of People in Washington Employed by Small Businesses: 1,379,558
- Number of Jobs Supported by SBA Loans from 2010 to 2018: 143,311
- Percent of Jobs Supported by SBA Loans from 2010 to 2018: 10.4%
- Number of Jobs Supported by SBA Loans in 2018: 16,429
- Percent of Jobs Supported by SBA Loans in 2018: 1.2%
SBA loan funds helped support more than 10% of the jobs created by small businesses in the state of Washington from 2010 to 2018.
Number of People in Washington Employed by Small Businesses
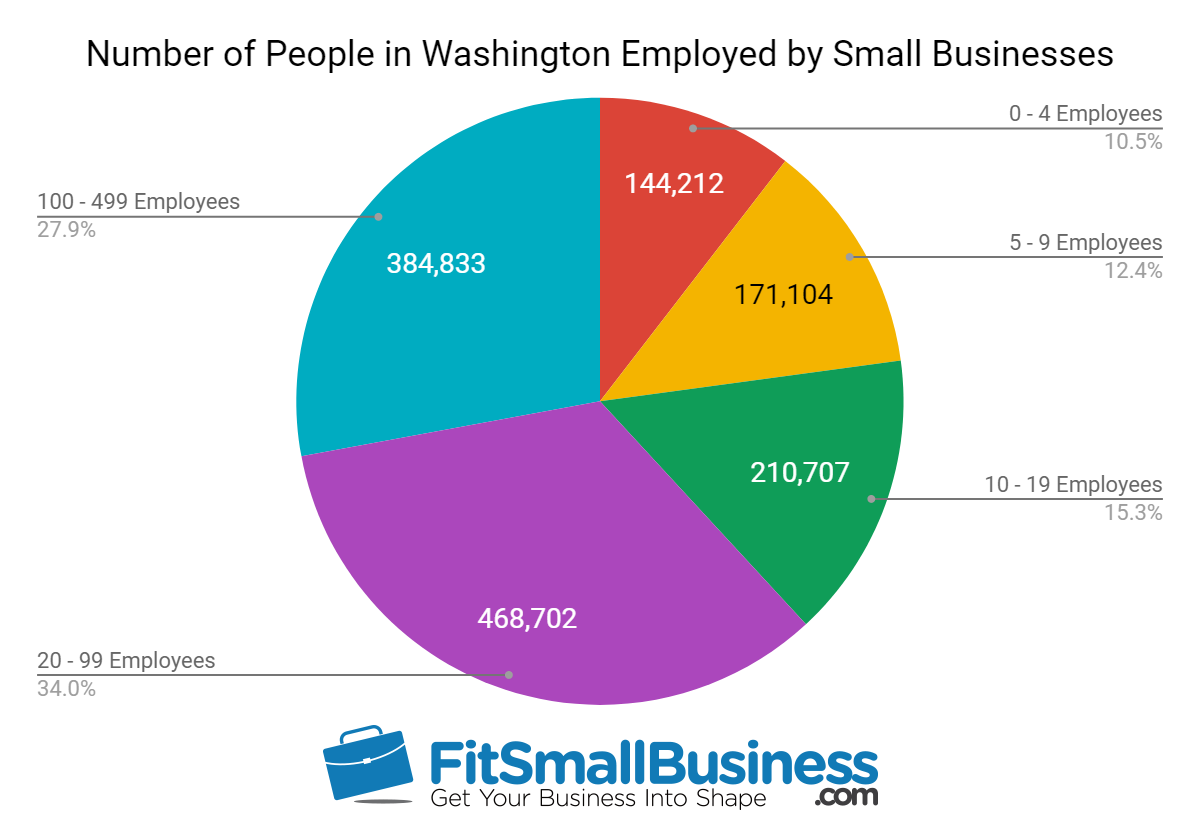
Source: SBA & SUSB Data
Washington SBA Franchise Loan Statistics
The SBA loan statistics for franchise financing in Washington from 2010 to 2018 are:
- Number of SBA Franchise Loans Made from 2010 to 2018: 908
- Top Franchise Funded by SBA Loans in Washington: Subway Sandwich
Of the 908 SBA franchise loans made in Washington between 2010 and 2018, 75 loans went to borrowers financing a Subway Sandwich franchise. Subway was in the list of the top 50 franchises as determined by SBA loan default rates from 2010 to 2018.
52. West Virginia SBA Statistics and Small Business Industry Statistics
As of 2016, small businesses employed 275,145 people in the state of West Virginia. Over $31 million in SBA loan funds went to small businesses in West Virginia in 2018 alone. The leading industry supported with SBA loan funds between 2010 and 2018 was the accommodation and food service industry, which received 192 loans, and is one of the top three small business industries in the state. The top franchise financed by SBA loans in West Virginia was Marco’s Pizza.
The SBA loan statistics and other small business industry statistics we evaluated for West Virginia are:
West Virginia SBA Loan Statistics
The primary SBA loan statistics for the state of West Virginia are:
- Top SBA Lender: The Huntington National Bank
- Number of SBA Loans Approved in 2018: 162
- Total Dollar Amount of SBA Loans Approved in 2018: $31,487,435
- Average Interest Rate of SBA Loans Made in 2018: 6.6%
- Average Loan Term for SBA Loans Made in 2018: 10 Years
- Average Default Rate of SBA Loans from 2010 to 2018: 16.8%
The Huntington National Bank is one of the top 100 SBA lenders, operating primarily in the Midwest, and was the leading SBA lender in West Virginia in 2018. The Huntington National Bank originated 54 loans totaling $3,089,200 in the state of West Virginia in fiscal year 2018. This represented 33% of the total number of SBA loans made in the state.
West Virginia Small Business Industry Statistics
The three NAICS codes for small businesses employing the largest number of people in West Virginia, and the number of SBA loans made in those industries are:
| Ranking |
|
|
|
|
|---|---|---|---|---|
| 1 |
|
|
|
|
| 2 |
|
|
|
|
| 3 |
|
|
|
|
West Virginia Small Business Employment Statistics
The number of people employed by small businesses in West Virginia, and the number of jobs supported by SBA loans are:
- Number of People in West Virginia Employed by Small Businesses: 275,145
- Number of Jobs Supported by SBA Loans from 2010 to 2018: 13,756
- Percent of Jobs Supported by SBA Loans from 2010 to 2018: 4.9%
- Number of Jobs Supported by SBA Loans in 2018: 1,192
- Percent of Jobs Supported by SBA Loans in 2018: 0.4%
SBA loan funds helped support roughly 5% of the jobs created by small businesses in the state of West Virginia from 2010 to 2018.
Number of People in West Virginia Employed by Small Businesses

Source: SBA & SUSB Data
West Virginia SBA Franchise Loan Statistics
The SBA loan statistics for franchise financing in West Virginia from 2010 to 2018 are:
- Number of SBA Franchise Loans Made from 2010 to 2018: 100
- Top Franchise Funded by SBA Loans in West Virginia: Marco’s Pizza
Of the 100 SBA franchise loans made in Wyoming between 2010 and 2018, nine loans went to borrowers financing a Marco’s Pizza franchise.
53. Wisconsin SBA Statistics and Small Business Industry Statistics
As of 2016, small businesses employed 1,258,929 people in the state of Wisconsin. Nearly $378 million in SBA loan funds went to small businesses in Wisconsin in 2018 alone. The leading industry supported with SBA loan funds between 2010 and 2018 was the accommodation and food service industry, which received 1,727 loans, and is one of the top three small business industries in the state. The top franchise financed by SBA loans in Wisconsin was Anytime Fitness.
The SBA loan statistics and other small business industry statistics we evaluated for Wisconsin are:
Wisconsin SBA Loan Statistics
The primary SBA loan statistics for the state of Wisconsin are:
- Top SBA Lender: The Huntington National Bank
- Number of SBA Loans Approved in 2018: 1,277
- Total Dollar Amount of SBA Loans Approved in 2018: $377,820,044
- Average Interest Rate of SBA Loans Made in 2018: 6.6%
- Average Loan Term for SBA Loans Made in 2018: 11 Years
- Average Default Rate of SBA Loans from 2010 to 2018: 13.5%
Wisconsin’s leading SBA lender in 2018 was The Huntington National Bank. Additionally, The Huntington National Bank is one of the top 100 SBA lenders nationwide. The Huntington National Bank originated 101 loans totaling $21,693,650 in the state of Wisconsin in fiscal year 2018. This represented 33% of the total number of SBA loans made in the state.
Wisconsin Small Business Industry Statistics
The three NAICS codes for small businesses employing the largest number of people in Wisconsin, and the number of SBA loans made in those industries are:
| Ranking |
|
|
|
|
|---|---|---|---|---|
| 1 |
|
|
|
|
| 2 |
|
|
|
|
| 3 |
|
|
|
|
Wisconsin Small Business Employment Statistics
The number of people employed by small businesses in Wisconsin, and the number of jobs supported by SBA loans are:
- Number of People in Wisconsin Employed by Small Businesses: 1,258,929
- Number of Jobs Supported by SBA Loans from 2010 to 2018: 156,090
- Percent of Jobs Supported by SBA Loans from 2010 to 2018: 12.4%
- Number of Jobs Supported by SBA Loans in 2018: 12,548
- Percent of Jobs Supported by SBA Loans in 2018: 1%
SBA loan funds helped support more than 12% of the jobs created by small businesses in the state of Wisconsin from 2010 to 2018.
Number of People in Wisconsin Employed by Small Businesses
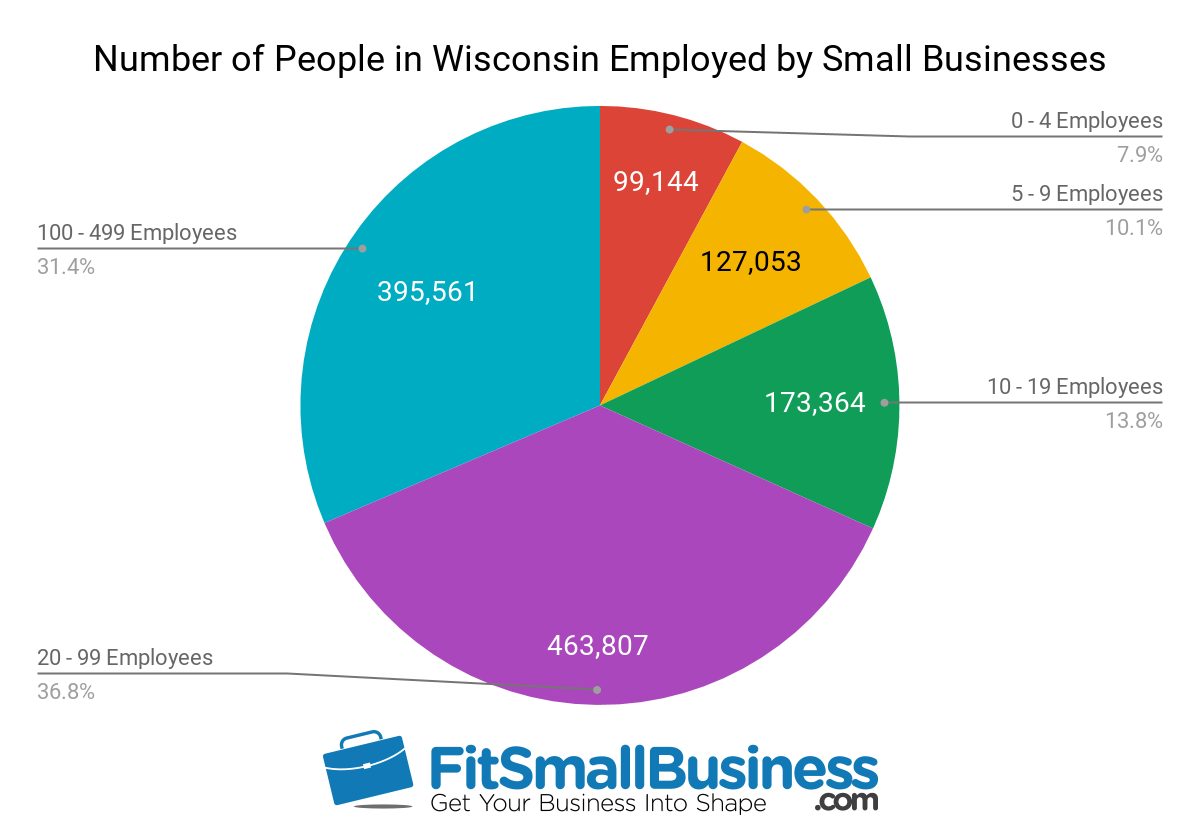
Source: SBA & SUSB Data
Wisconsin SBA Franchise Loan Statistics
The SBA loan statistics for franchise financing in Wisconsin from 2010 to 2018 are:
- Number of SBA Franchise Loans Made from 2010 to 2018: 917
- Top Franchise Funded by SBA Loans in Wisconsin: Anytime Fitness
Of the 917 SBA franchise loans made in Wisconsin between 2010 and 2018, 39 loans went to borrowers financing an Anytime Fitness franchise.
54. Wyoming SBA Statistics and Small Business Industry Statistics
As of 2016, small businesses employed 131,499 people in the state of Wyoming. Nearly $24 million in SBA loan funds went to small businesses in Wyoming in 2018 alone. The leading industry supported with SBA loan funds between 2010 and 2018 was the construction industry, which received 123 loans, and is one of the top three small business industries in the state. The top franchise financed by SBA loans in Wyoming was Subway Sandwich.
The SBA loan statistics and other small business industry statistics we evaluated for Wyoming are:
Wyoming SBA Loan Statistics
The primary SBA loan statistics for the state of Wyoming are:
- Top SBA Lender: Bank of Bridger
- Number of SBA Loans Approved in 2018: 97
- Total Dollar Amount of SBA Loans Approved in 2018: $23,883,905
- Average Interest Rate of SBA Loans Made in 2018: 7.1%
- Average Loan Term for SBA Loans Made in 2018: 12 Years
- Average Default Rate of SBA Loans from 2010 to 2018: 13.9%
Bank of Bridger is a regional bank that serves Montana and Wyoming. Bank of Bridger originated 23 loans totaling $1,665,630 in the state of Wyoming in fiscal year 2018. This represented 23.7% of the total number of SBA loans made in the state.
Wyoming Small Business Industry Statistics
The three NAICS codes for small businesses employing the largest number of people in Wyoming, and the number of SBA loans made in those industries are:
| Ranking |
|
|
|
|
|---|---|---|---|---|
| 1 |
|
|
|
|
| 2 |
|
|
|
|
| 3 |
|
|
|
|
Wyoming Small Business Employment Statistics
The number of people employed by small businesses in Wyoming, and the number of jobs supported by SBA loans are:
- Number of People in Wyoming Employed by Small Businesses: 131,499
- Number of Jobs Supported by SBA Loans from 2010 to 2018: 8,269
- Percent of Jobs Supported by SBA Loans from 2010 to 2018: 6.3%
- Number of Jobs Supported by SBA Loans in 2018: 609
- Percent of Jobs Supported by SBA Loans in 2018: 0.5%
SBA loan funds helped support more than 6% of the jobs created by small businesses in the state of Wyoming from 2010 to 2018.
Number of People in Wyoming Employed by Small Businesses
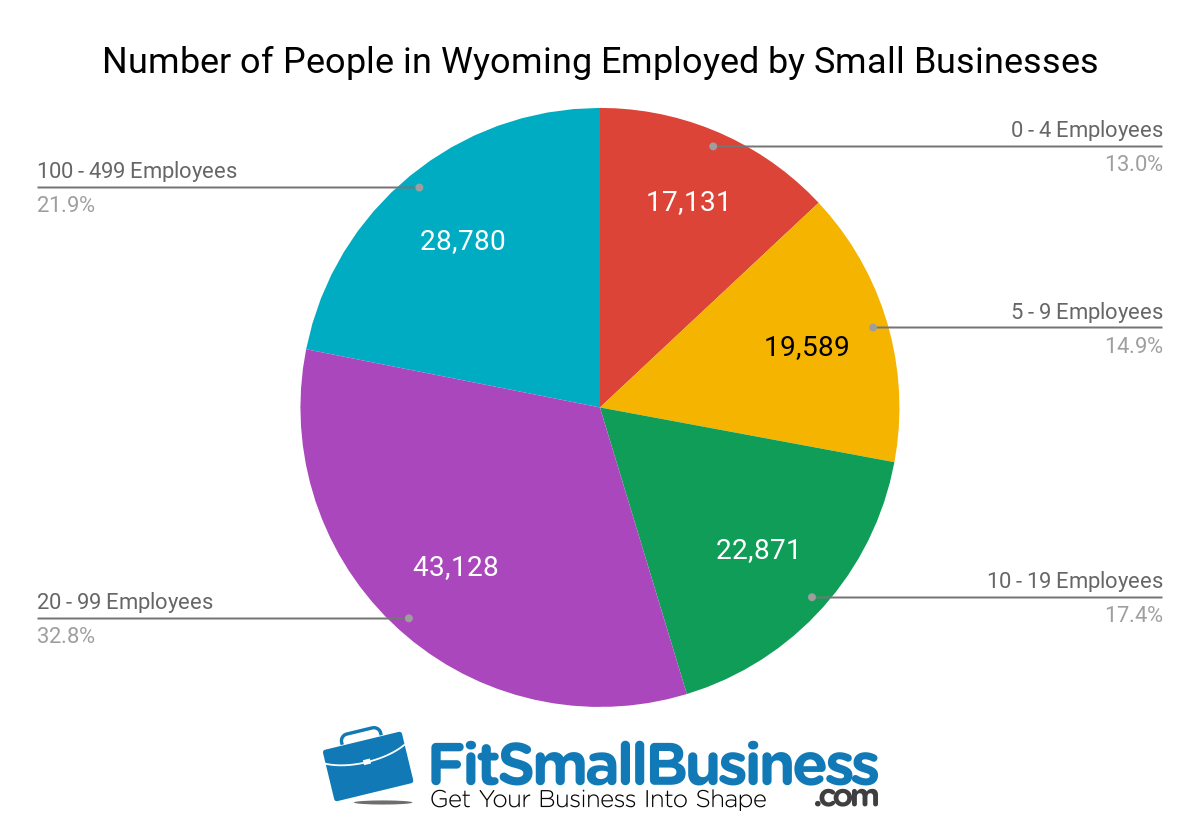
Source: SBA & SUSB Data
Wyoming SBA Franchise Loan Statistics
The SBA loan statistics for franchise financing in Wyoming from 2010 to 2018 are:
- Number of SBA Franchise Loans Made from 2010 to 2018: 50
- Top Franchise Funded by SBA Loans in Wyoming: Subway Sandwich
Of the 50 SBA franchise loans made in Wyoming between 2010 and 2018, six loans went to borrowers financing a Subway Sandwich franchise. Subway was in the list of the top 50 franchises as determined by SBA loan default rates from 2010 to 2018.
Bottom Line
Small businesses play a huge role in the American economy, and are as diverse as the states that they derive from. Whether your small business is a multigenerational construction business in Utah, or an up and coming technology startup in California, you’ve likely considered financing through the Small Business Administration at some point. The SBA plays a pivotal role in keeping American small businesses prospering.
Read More


0 تعليقات